James Tone Stack - Create Your Own Design
Based on our analysis of the James tone stack, let's design our own stack. Our key concerns are the overall attenuation level at midrange and the transition frequencies between bass, midrange, and treble. Greater midrange attenuation facilitates possible bass and treble boost, but requires greater overall voltage gain in the signal chain. The transition frequencies determine the frequency ranges that can be boosted or attenuated.
To convert our theoretical knowledge into a practical strategy we translate the equations that determine frequency response based on parts values into equations that determine parts values based on the desired frequency response. This will be demonstrated using a concrete example. For design goals let's set the mid-range attenuation to 8dB at maximum control settings, the bass-to-midrange transition to 500Hz, and the midrange-to-treble transition to 1kHz. With the controls at minimum let's choose a flatter response than the Orange Graphic and set the bass-to-midrange transition to 200Hz and the midrange-to-treble transition to 1.4kHz.
|
Guitar Amplifier Electronics: Fender Deluxe - from TV front to narrow panel to brownface to blackface Reverb |
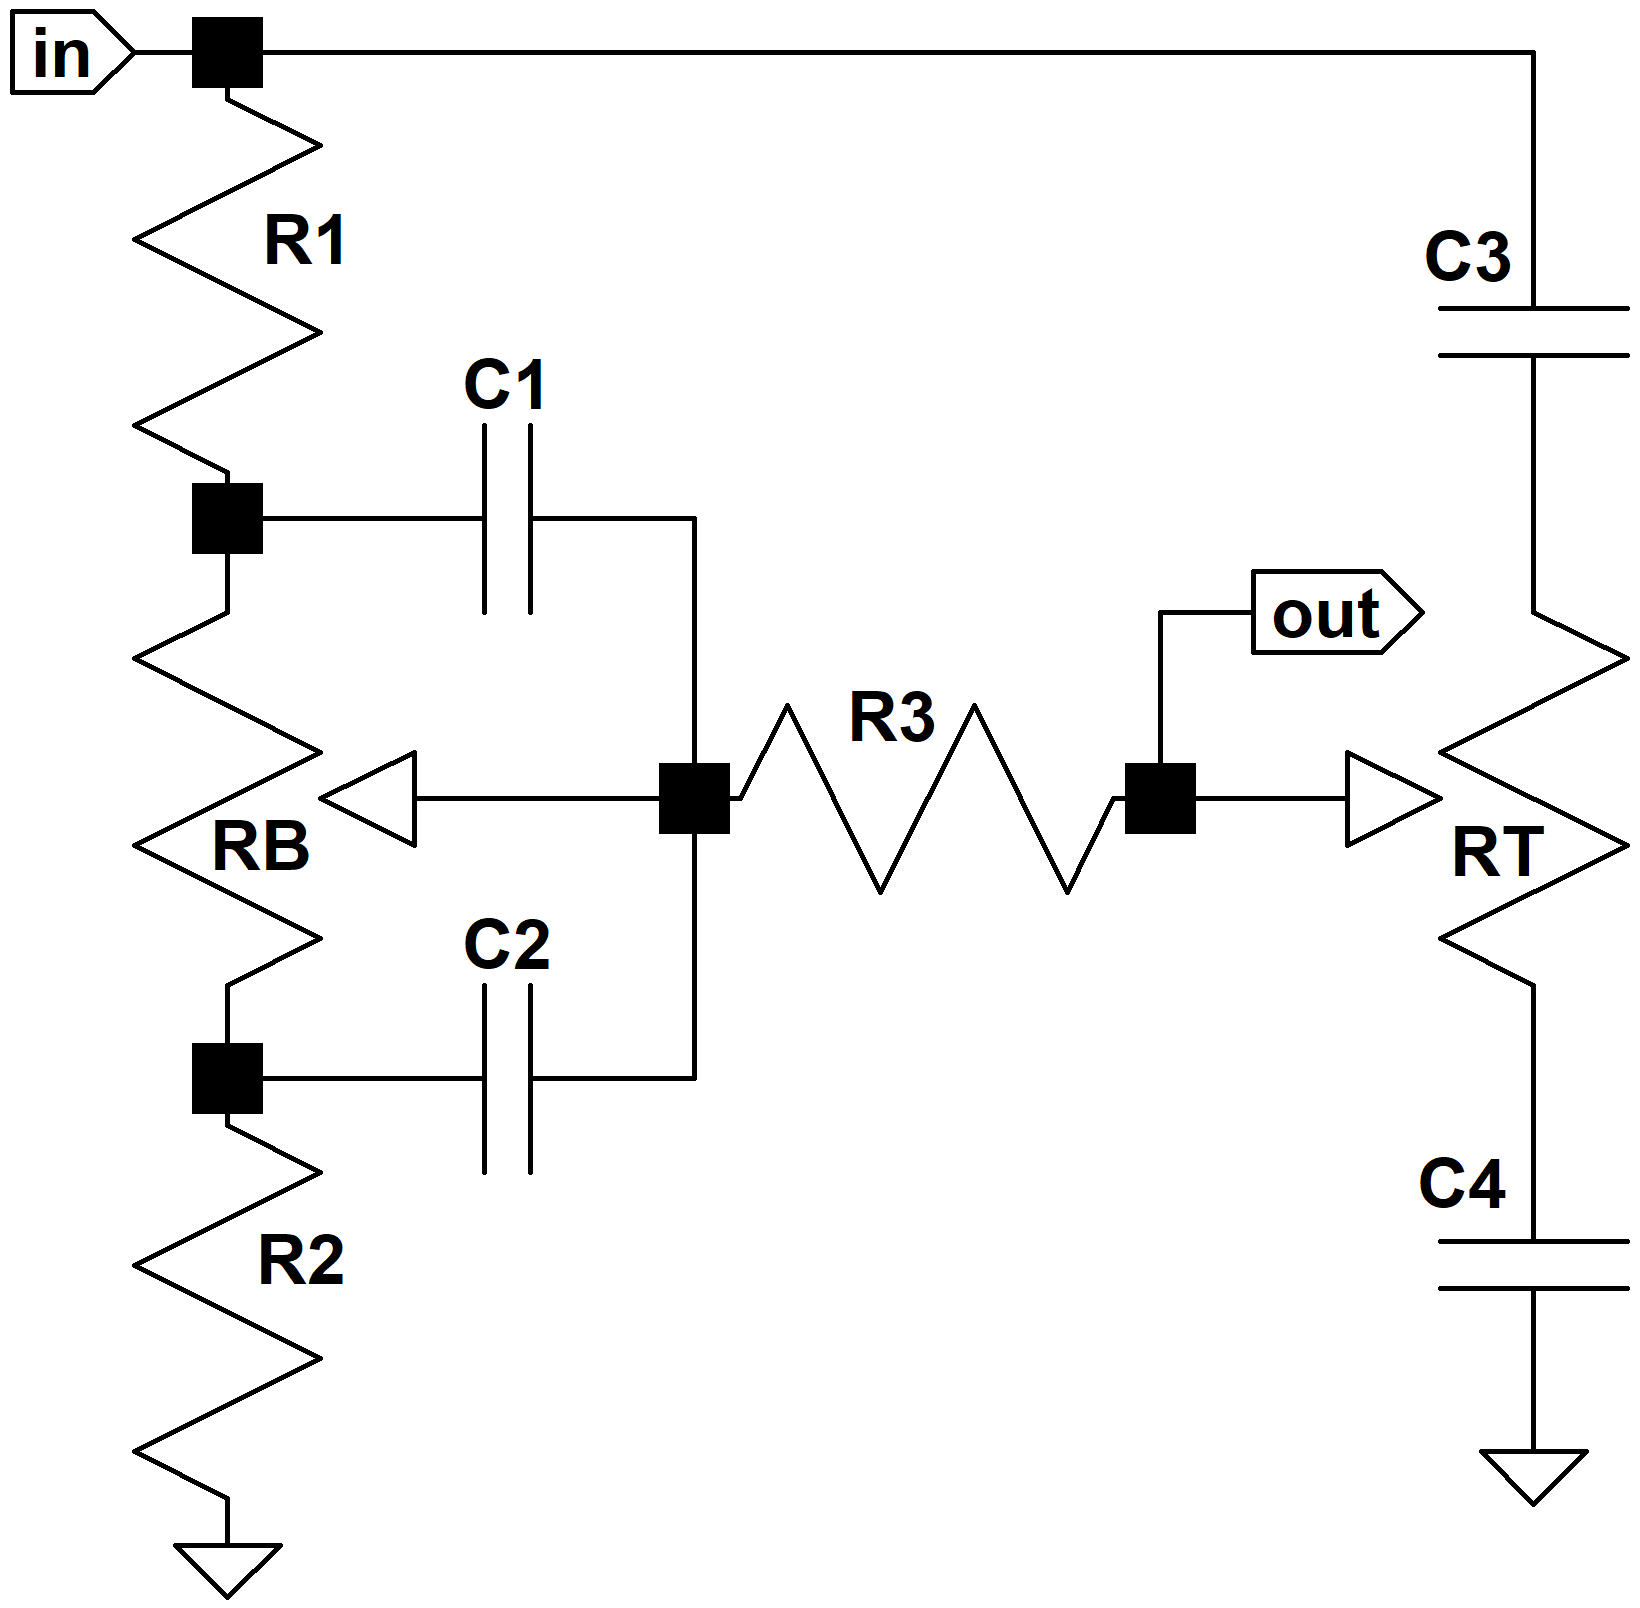
Midrange attenuation is determined by R1 and R2. Let's set R1 = R3 = 100k, which is substantially higher than the output impedance of a typical driving stage and yet substantially less than the input impedance that a tone stack typically drives. Midrange attenuation is
This means the value of R2 as a function of midrange attenuation G, which is a number between zero and one, is
For minus 8dB the voltage gain is
for which we get a value of R2 = 66k. (We'll use 68k, the closest common part value.)
|
Guitar Amplifier Electronics: Basic Theory - master the basics of preamp, power amp, and power supply design. |
Setting the Bass-Midrange Transition Frequency
With the bass control at maximum, gain changes by at most 6dB per octave. This can't be altered - it's the basic nature of the circuit. So when we set the midrange attenuation and one of the bass transition frequencies, we effectively select the other as well. The bass-to-midrange transition frequency is given by
The capacitor value needed is thus
For our design goal of 500 Hz, for example, we get C2 = 4700pF. This puts the lower-bass transition frequency at
which is 202 Hz. Above this frequency the response transitions to its midrange value, decreasing at a rate of 6dB per octave until we reach 500 Hz. Here is the bass response, bass control at maximum, for R1 = R3 = 100k, R2 = 68k, and C2 = 4700pF:
|
Fundamentals of Guitar Amplifier System Design - design your amp using a structured, professional methodology. |
Setting the Midrange-Treble Transition Frequency
The midrange-treble Transition Frequency is
The value of C3 based on the desired transition frequency is thus
For 1kHz we get C3 = 460pF. (We'll use 470pF.) Here is the treble response with the control set to maximum:
Here is the superposition of the bass and treble response curves:
Our Bode plots and part value calculations assume a zero-impedance source, infinite-impedance tone controls, and an infinite-impedance load. Here is the actual response using Electronics Workbench Multisim®. The plot assumes a Fender Bassman environment with 1M tone controls. The source impedance is a 12AX7 cathode follower with an output impedance of 500 ohms and the driven stage is a long-tailed-pair phase inverter with an input impedance of 3M.
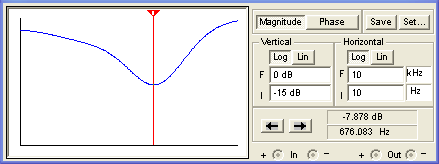
(The horizontal axis is a log scale of frequency from 10Hz to 10kHz and the vertical scale is from -15dB to 0dB.) The next plot below assumes the tone stack is driven by a 12AX7 voltage amplifier with an output impedance of 39k and a follow-on grid resistor representing an input impedance of 1M.
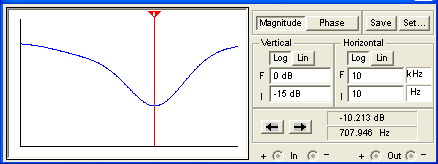
There is greater overall attenuation and a slight shift upward in the frequency at which gain is minimum, but the response is not dramatically different.
|
Guitar Amplifier Electronics: Circuit Simulation - know your design works by measuring performance at every point in the amplifier. |
Setting the Remaining Capacitor Values
Here are the formulas we derived earlier for the bass-midrange and midrange-treble transition frequencies when the tone controls are set to minimum:
The first is the bass-midrange transition frequency and the second is the midrange-treble transition frequency. Turning these around we get
For our design goals of 200Hz and 1.4kHz we get C4 = 4700pF and C1 = 680pF.
Here is the response when both controls are set to minimum:
Here is the response using Electronics Workbench Multisim®. The plot below assumes a Fender Bassman environment with 1M tone controls. The source impedance is a 12AX7 cathode follower with an output impedance of 500 ohms and the driven stage is a long-tailed-pair phase inverter with an input impedance of 3M.
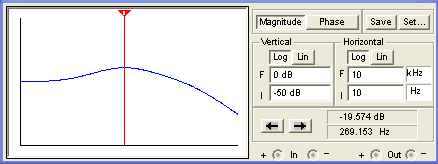
(The horizontal axis is a log scale of frequency from 10Hz to 10kHz and the vertical scale is from -50dB to 0dB.) The next plot below assumes the tone stack is driven by a 12AX7 voltage amplifier with an output impedance of 39k and a follow-on grid resistor representing an input impedance of 1M.
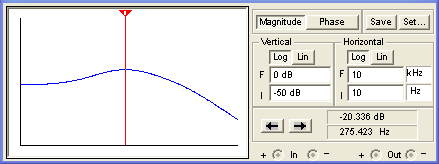
Here is the final circuit:
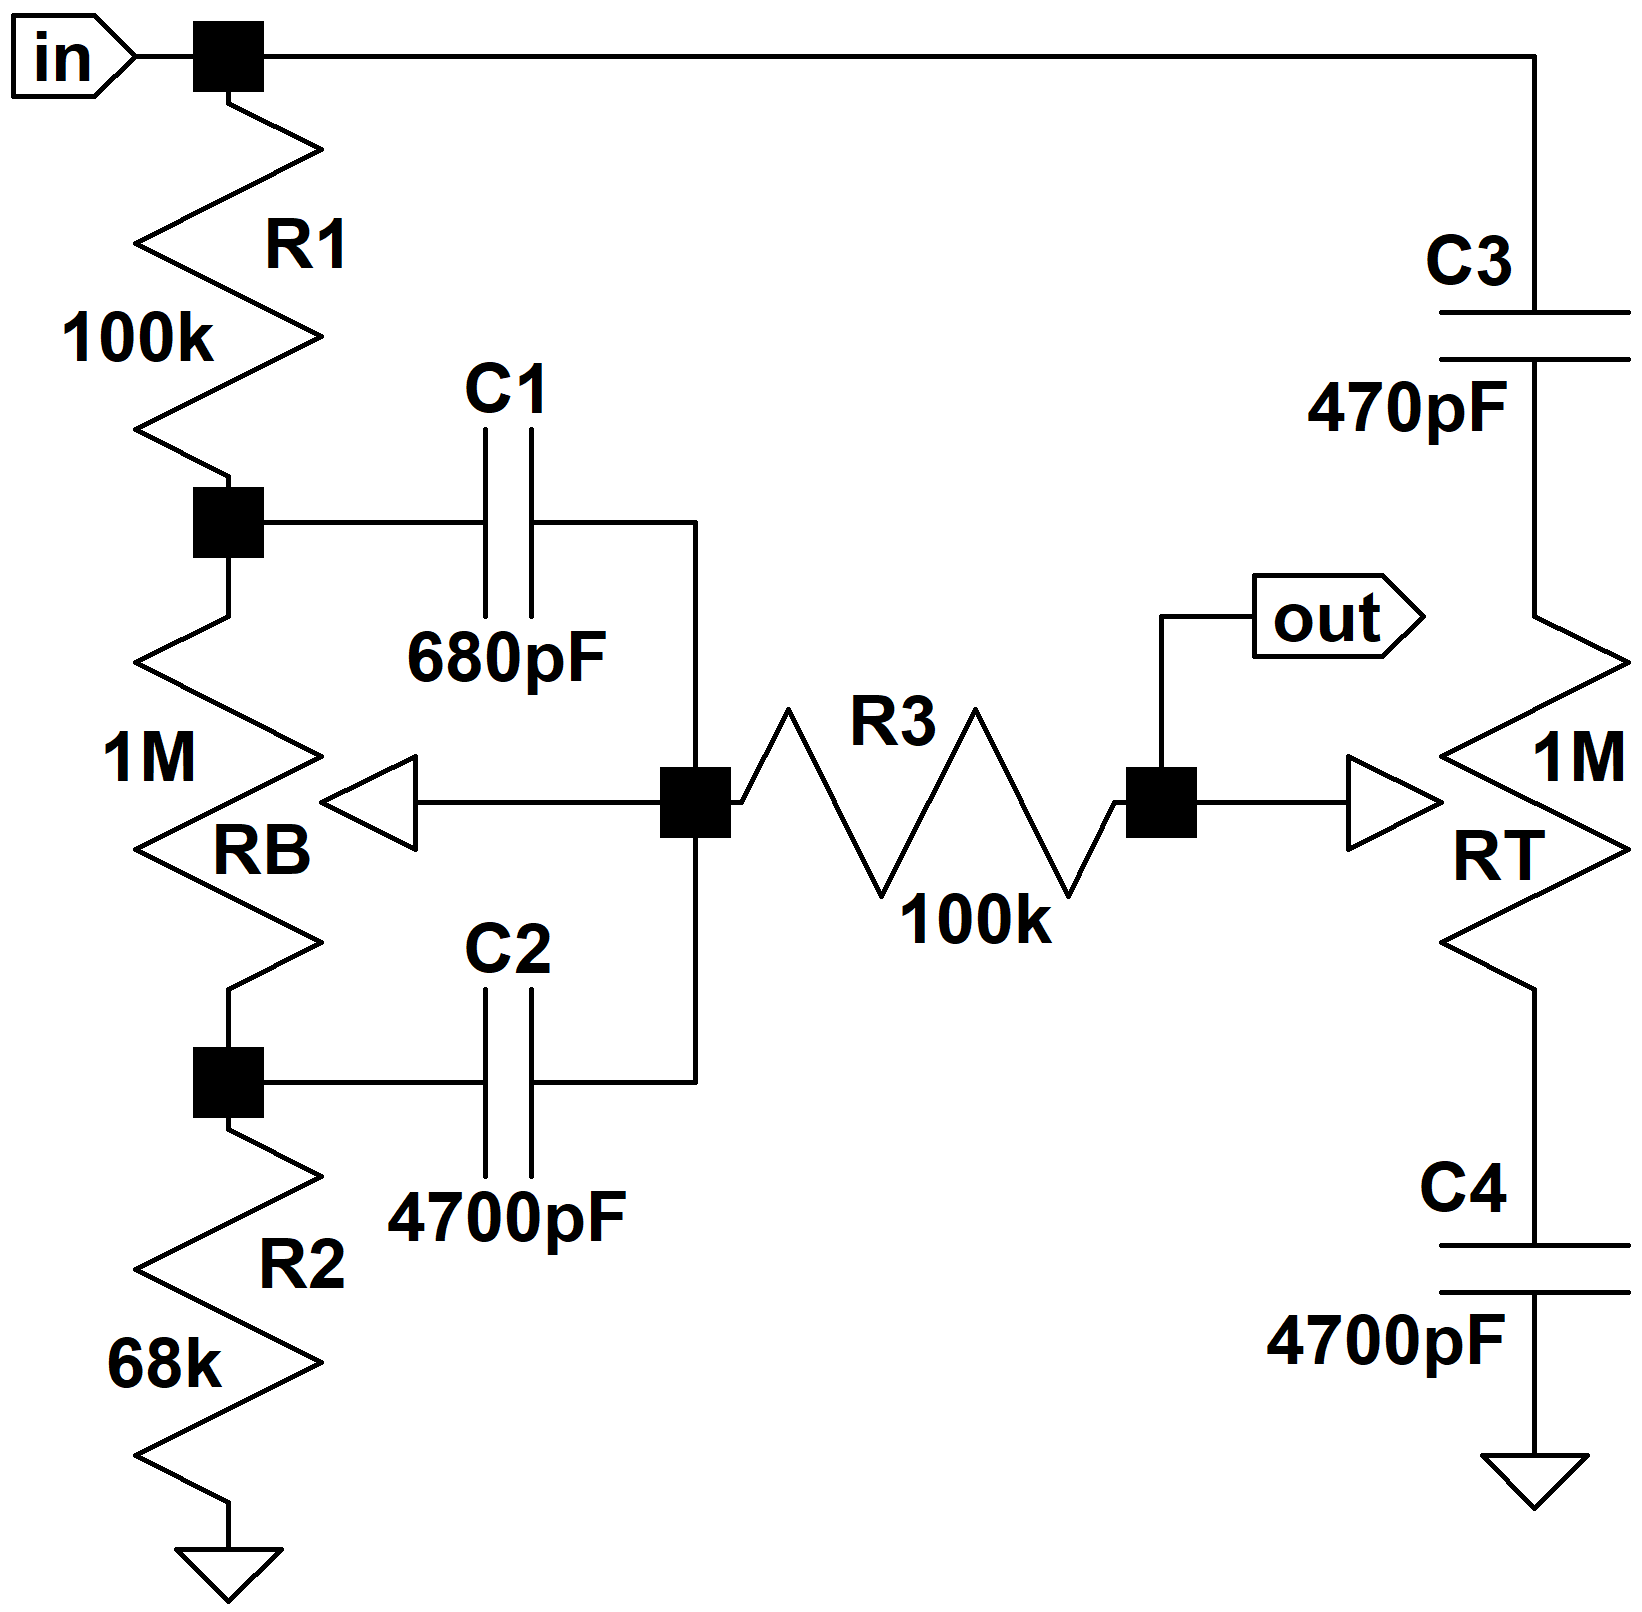
If you're getting a feeling of déjà vu, it's probably because these parts values are identical to those found in the Garnet G250TR and G250D amplifiers.