SPICE Simulation of the Epiphone Deluxe EA-10 Power Amp
Cathode Bypass Capacitor Performance in a Push-Pull Power Amp
For a single-ended power amp, such as the one for the Fender Champ 5E1, the cathode bypass capacitor value affects frequency response in an easily understood way.
For low frequencies, the capacitor acts as an open circuit, allowing the cathode voltage to vary. The voltage changes in a way that works against changes in grid voltage, introducing a form of negative feedback that reduces gain. At audio frequencies the capacitor acts like a short circuit, grounding the cathode and eliminating the negative feedback for maximum gain. A large capacitor value creates maximum gain and a flat frequency response. A smaller value can create bass cut.
For the Champ, the simplicity of our understanding of cathode bypass capacitor performance is facilitated by the single-tube design. Cathode current increases and decreases in response to the guitar signal. If the input signal is a 1kHz sine wave, then voltages and currents throughout the circuit swing to the 1kHz beat of the input.

|
Guitar Amplifier Electronics: Fender Deluxe - from TV front to narrow panel to brownface to blackface Reverb |
For a push-pull design like the Epiphone Deluxe EA-10, the situation is more complicated.
For a half cycle, the cathode current increases for one tube and decreases for the other. For the next half cycle, the tubes reverse roles. From the perspective of the cathode circuit, voltage and current swing to a 2kHz beat. Intuitively, cathode bypass capacitor performance must be different than in the Champ. Let's run some SPICE simulations on the EA-10 power amp, focusing on the effects of the cathode bypass capacitor value.
The voltages shown in the schematic above are Epiphone's measured values relative to ground. Output transformer impedances are not included, so we will select a modern replacement transformer that seems appropriate.
|
Guitar Amplifier Electronics: Basic Theory - master the basics of preamp, power amp, and power supply design. |
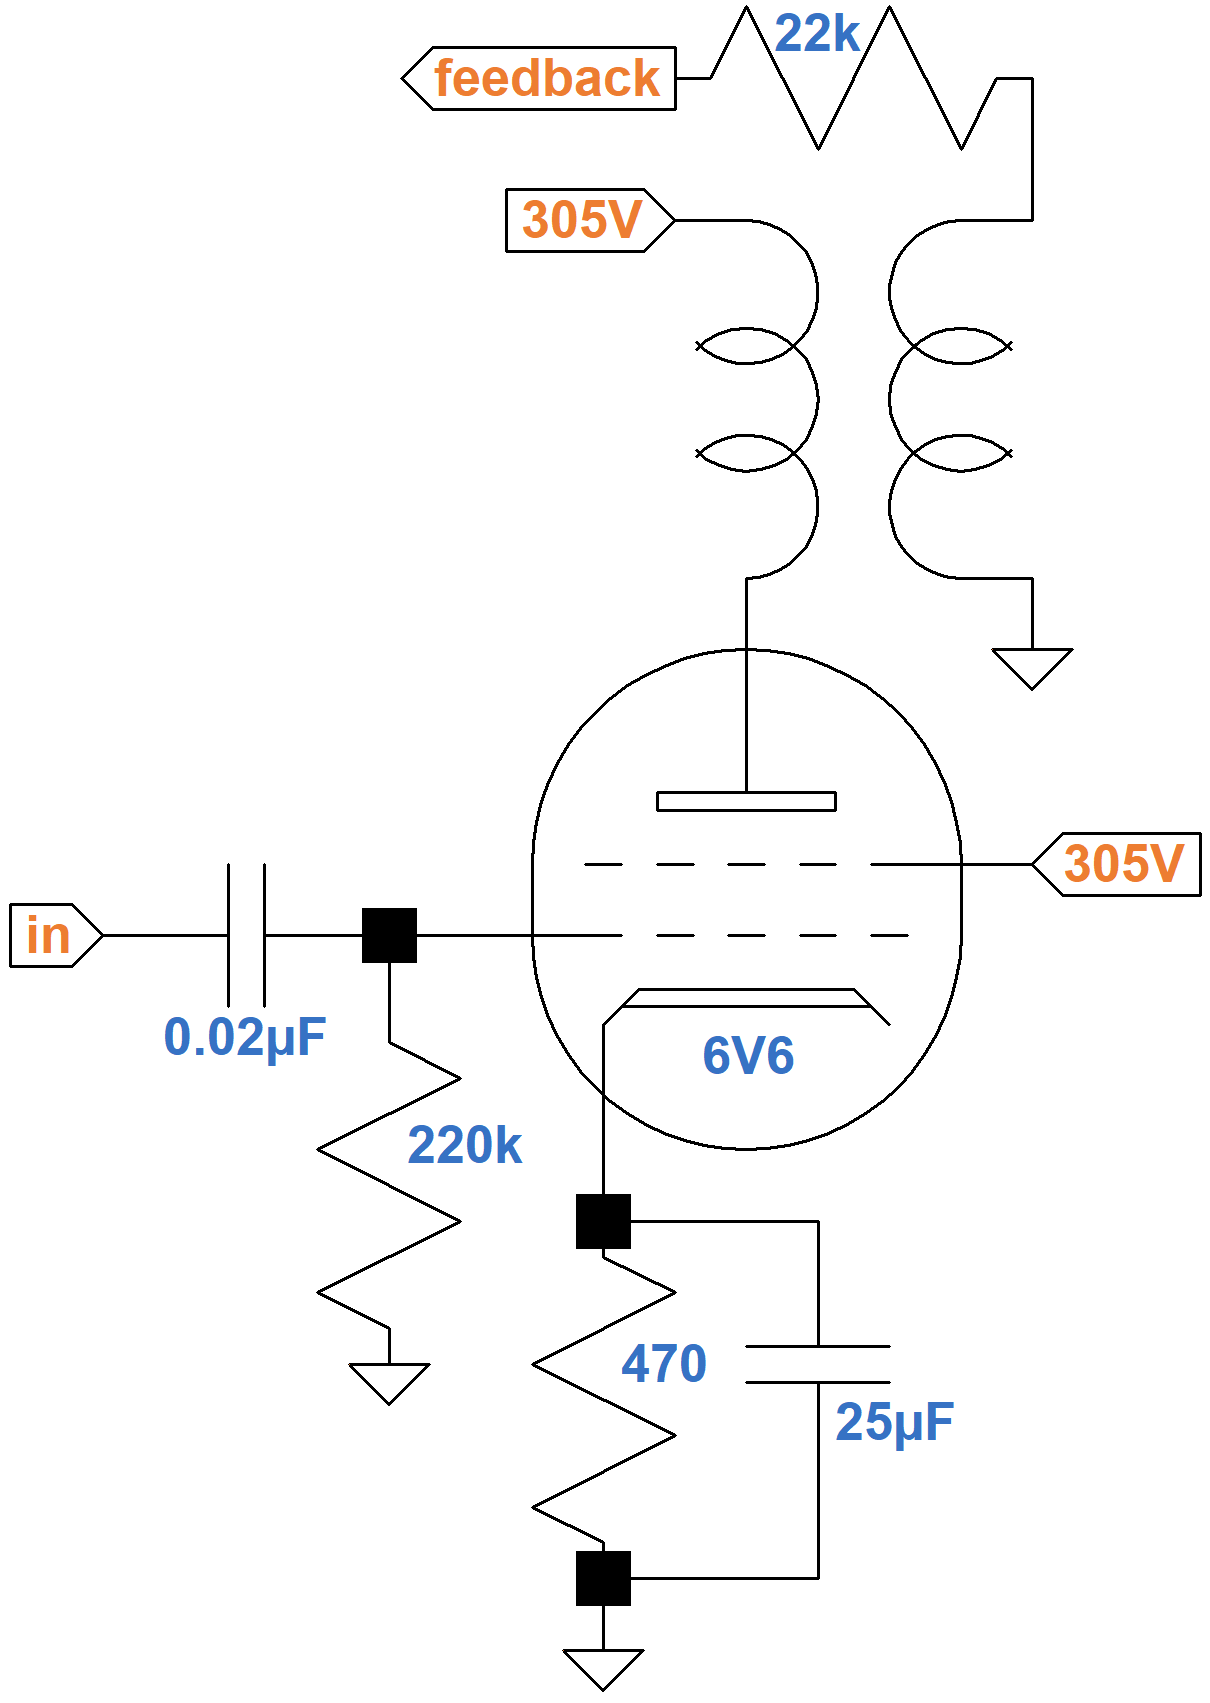
For our SPICE simulations we will use an Adrian Immler large-signal 6L6 model, which does an excellent job at capturing the nuances of beam power tetrode performance. Here is an LTspice schematic for running a DC operating point simulation1 that sets the plate and screen voltages and allows the cathode voltage to settle to a calculated DC value.
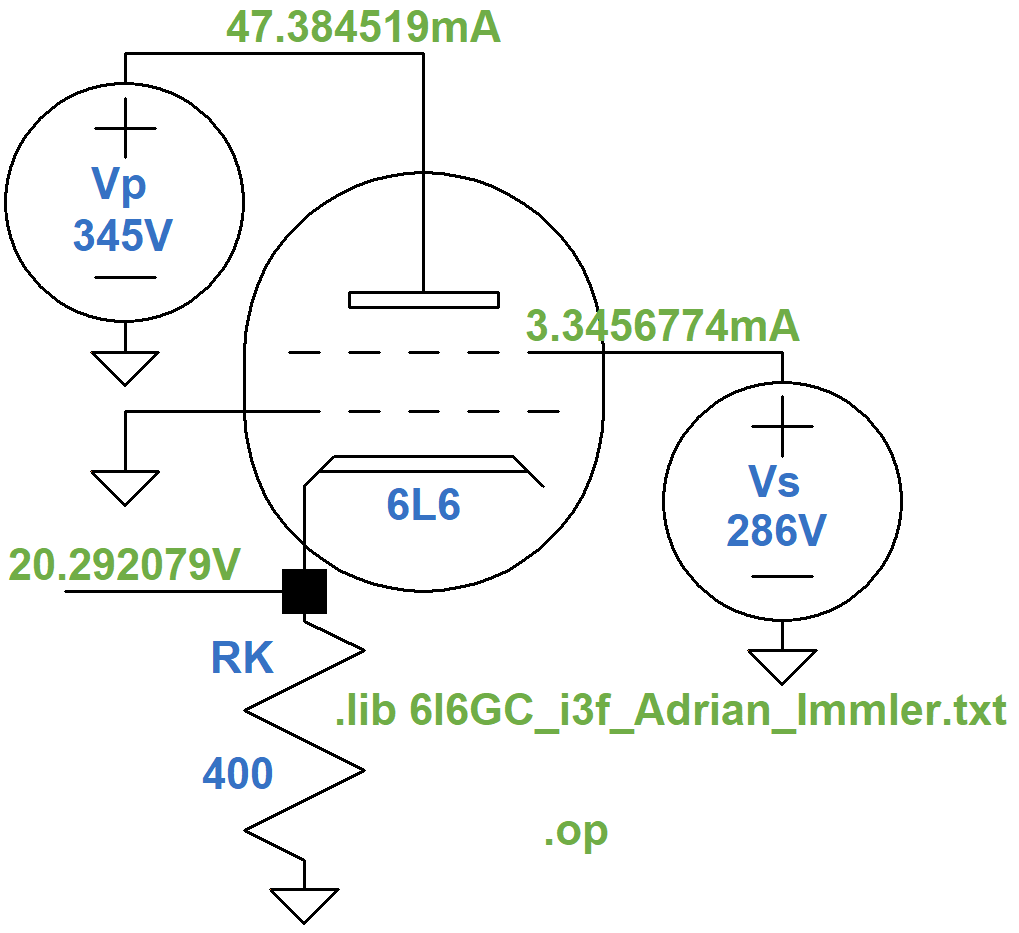
Since only one tube is included, the cathode resistor value is doubled to achieve the same DC cathode voltage. According to the simulation, it is 20.3V, which is close to Epiphone's measured value of 21.5V.
|
Fundamentals of Guitar Amplifier System Design - design your amp using a structured, professional methodology. |
For a plate-to-cathode voltage of 250V, a screen-to-cathode voltage of 266V and a 0V grid, the 6L6 plate transfer characteristics show that the plate current is about 198mA, as shown by the red dot.
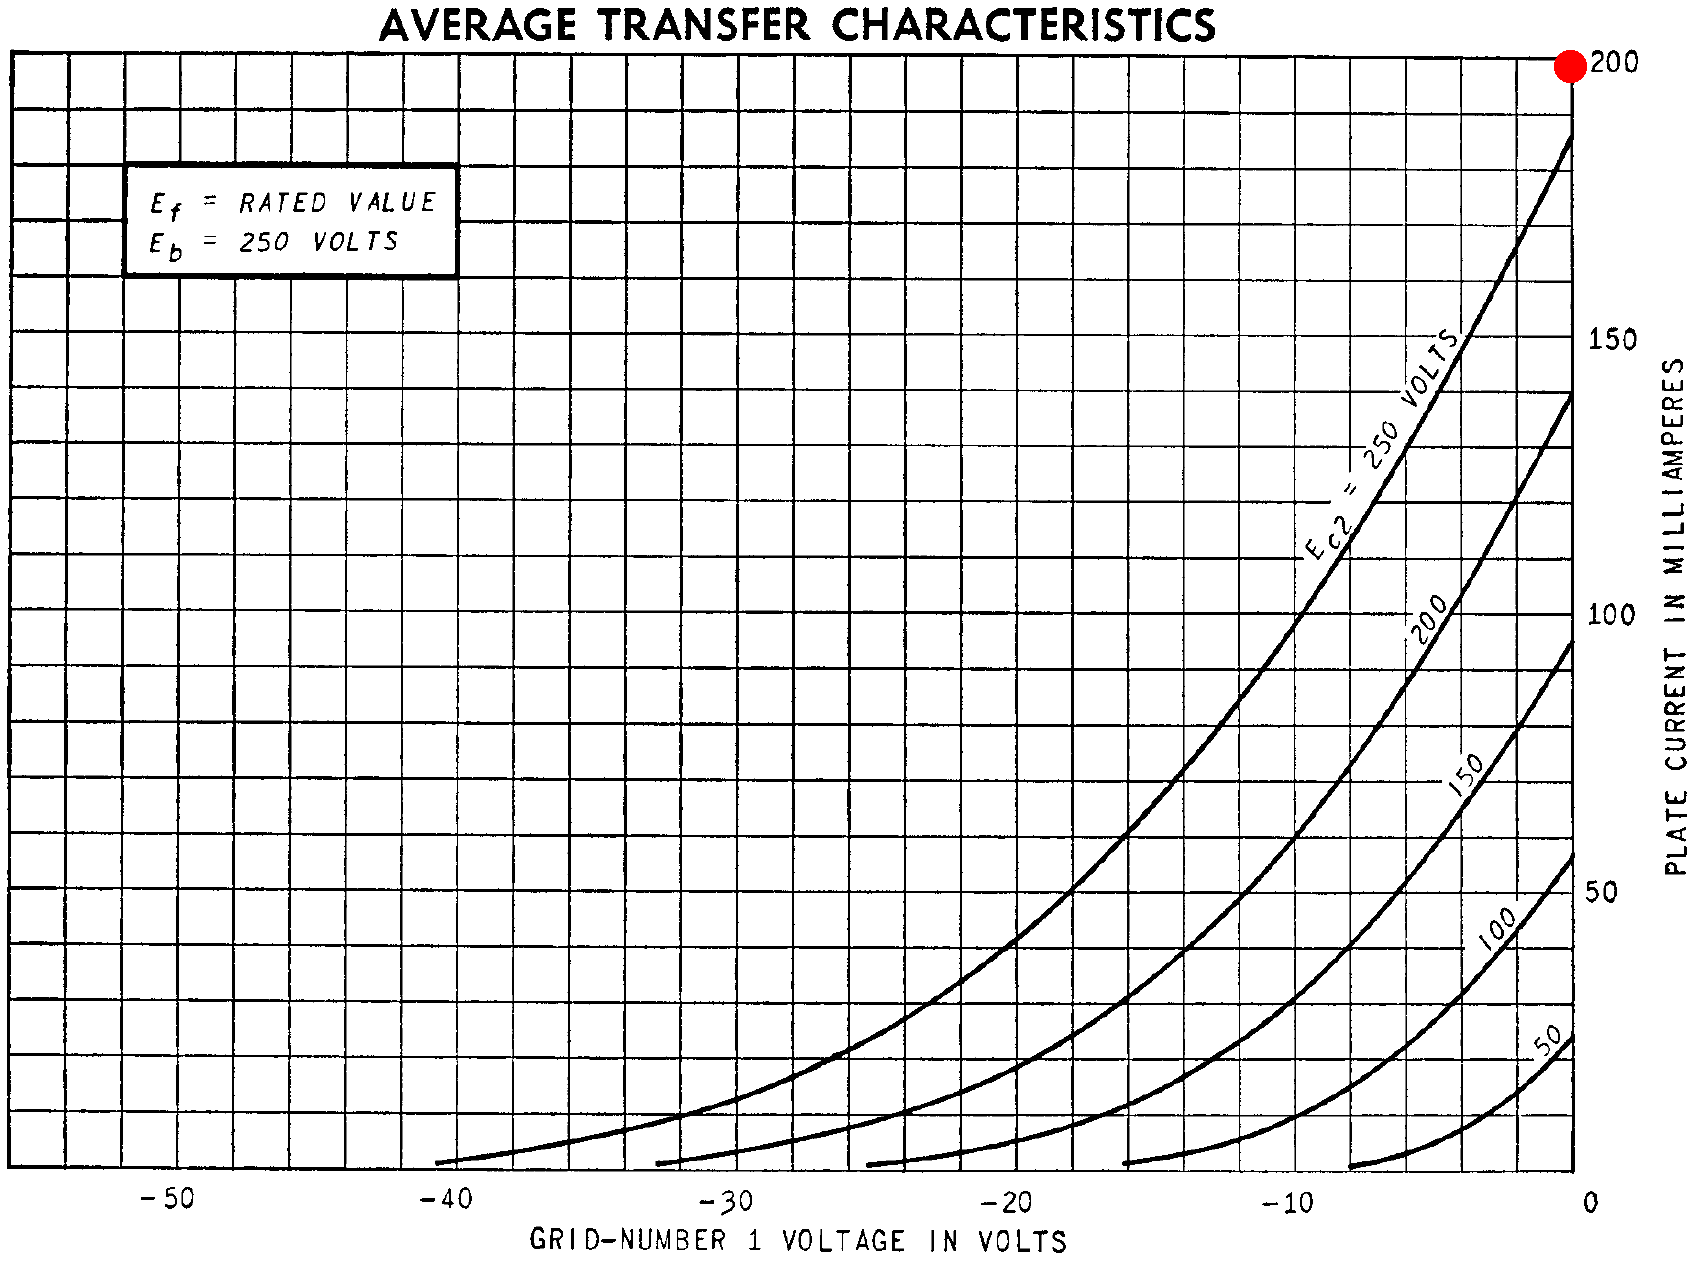
This can mark an anchor point, the red dot shown here, on the plate characteristics for the curve corresponding to a 266V screen.
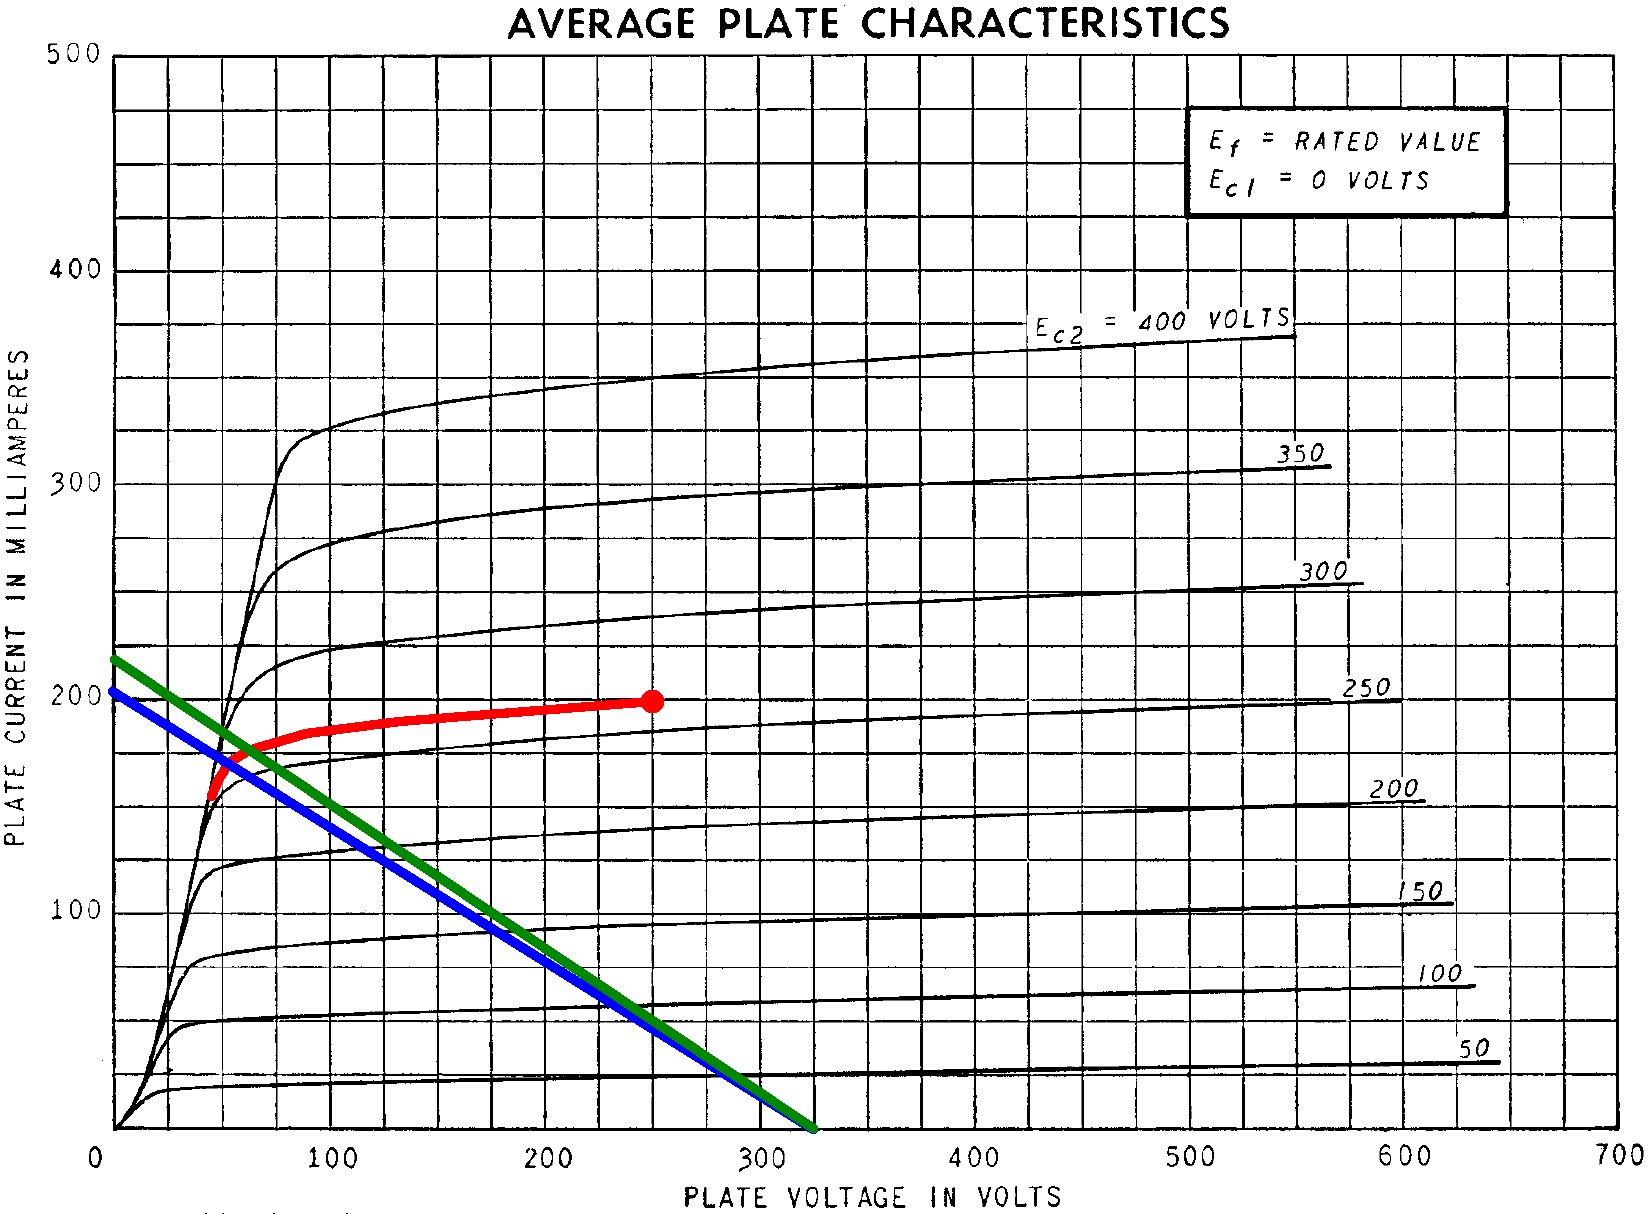
The plate-to-cathode voltage is 325V. The blue line represents a load impedance that puts the load line through the knee of the 266V curve to create maximum power. The load line intersects the curve at a plate voltage of 55V and a plate current of 170mA, so RMS output power is approximately
(325V - 55V)(170mA) / 2 = 23W
According to Ohm's Law, the load impedance is
(325V - 55V) / 170mA = 1.6kΩ
Assuming pure Class B operation, the plate-to-plate primary impedance is 4 times greater: 6.4kΩ, so the transformer needs to be rated for 25 watts with a primary impedance in this vicinity. Hammond's 30W replacement transformer for the Marshall JTM30 has a 6kΩ primary, so if it is used in the Epiphone circuit, we get the green load line with approximately the same output power.
|
Guitar Amplifier Electronics: Circuit Simulation - know your design works by measuring performance at every point in the amplifier. |
For our SPICE model, let's arbitrarily set the inductance for each half of the primary to a value of 10H. Normally the total inductance of two inductors in series is equal to the sum of their individual inductances. If they were chokes, for example, the total inductance would be 20H. Our inductors are magnetically coupled, however, so we use 40H for the purposes of determining the secondary inductance needed to drive an 8Ω speaker:
(8Ω / 6kΩ)(40H) = 53mH
Full Power Performance
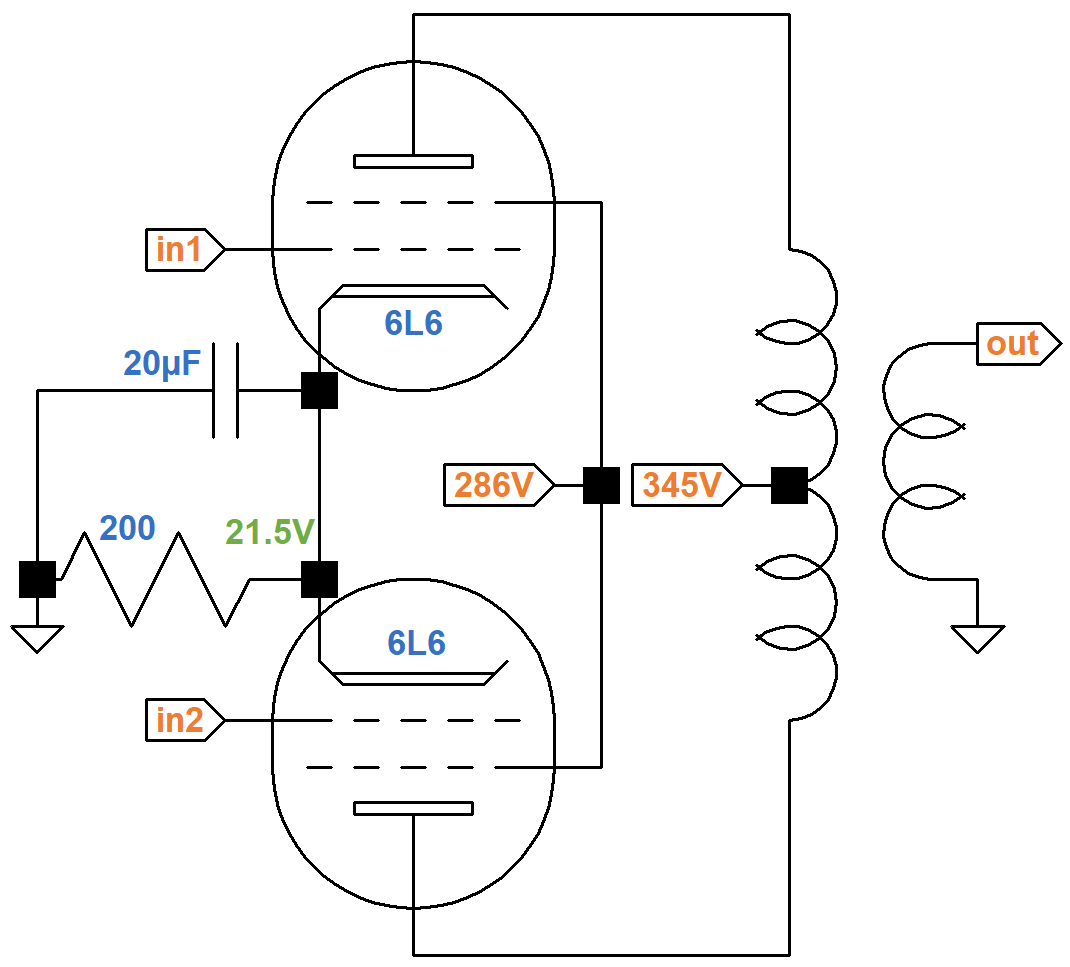
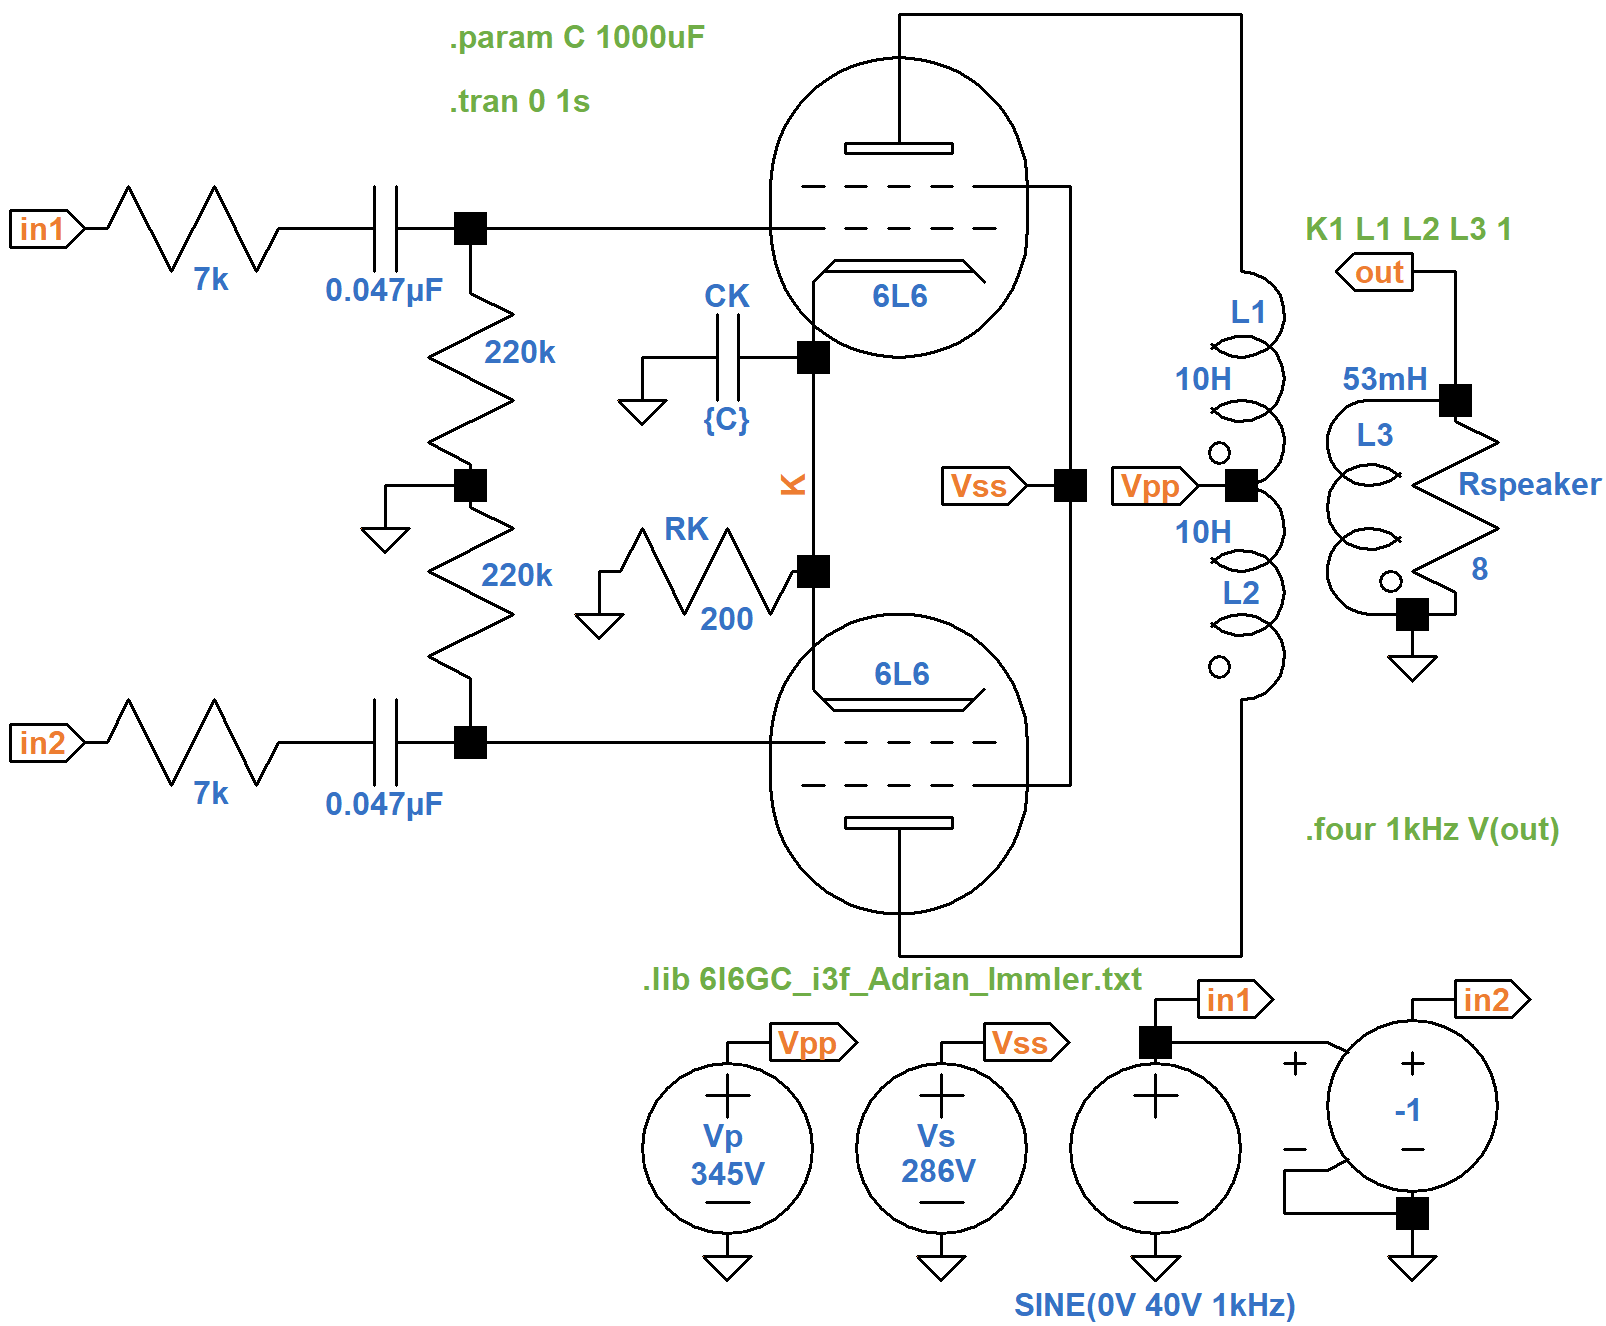
Here is an LTspice schematic to run transient simulations2 on the EA-10 circuit, but with a twist: the cathode bypass capacitor is huge: 1000μF.
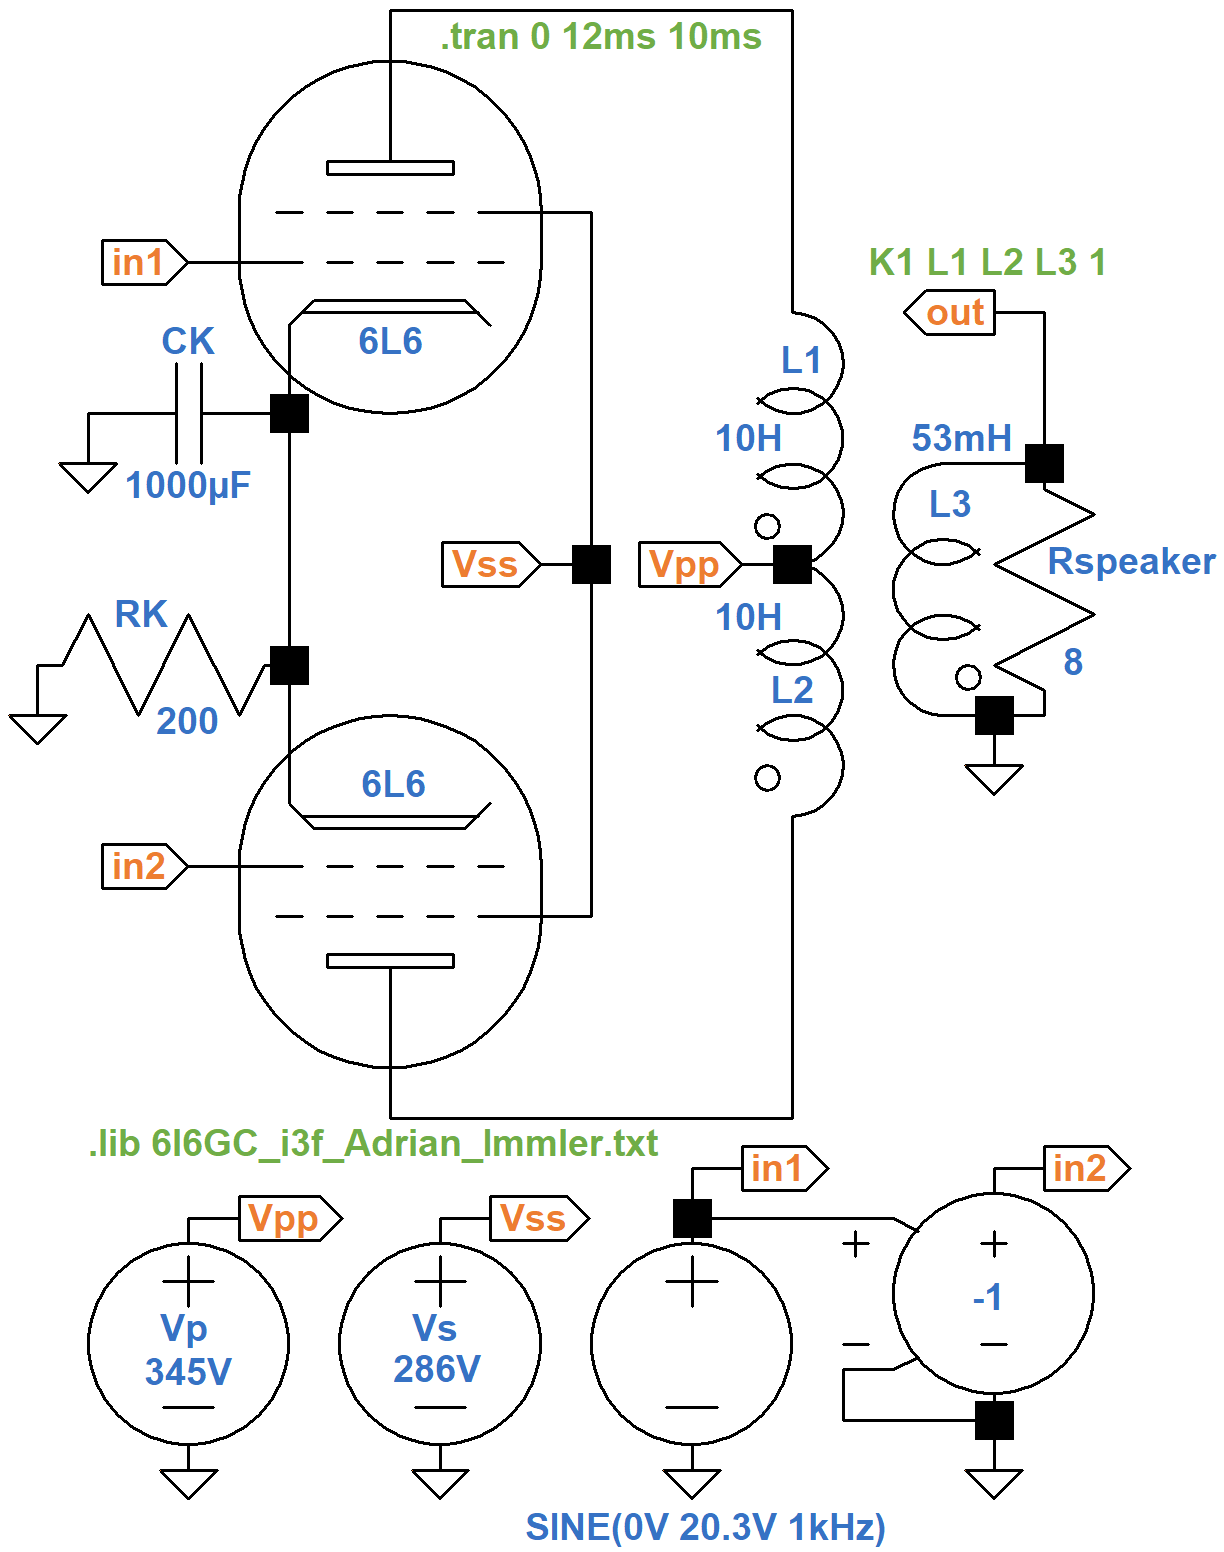
The .tran SPICE directive runs the simulation
for 10 milliseconds to allow transients to subside and then
records 2 milliseconds of data.
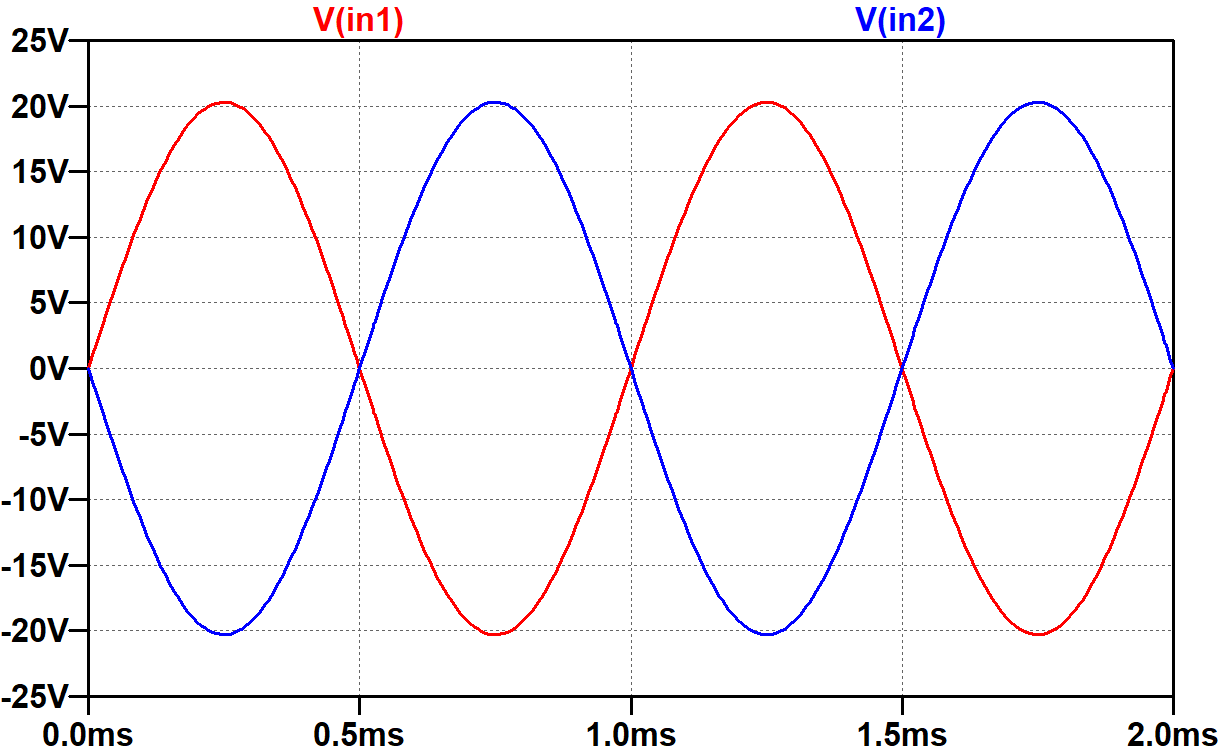
This is enough time to record two cycles of the 1kHz voltage source
that drives node in1.
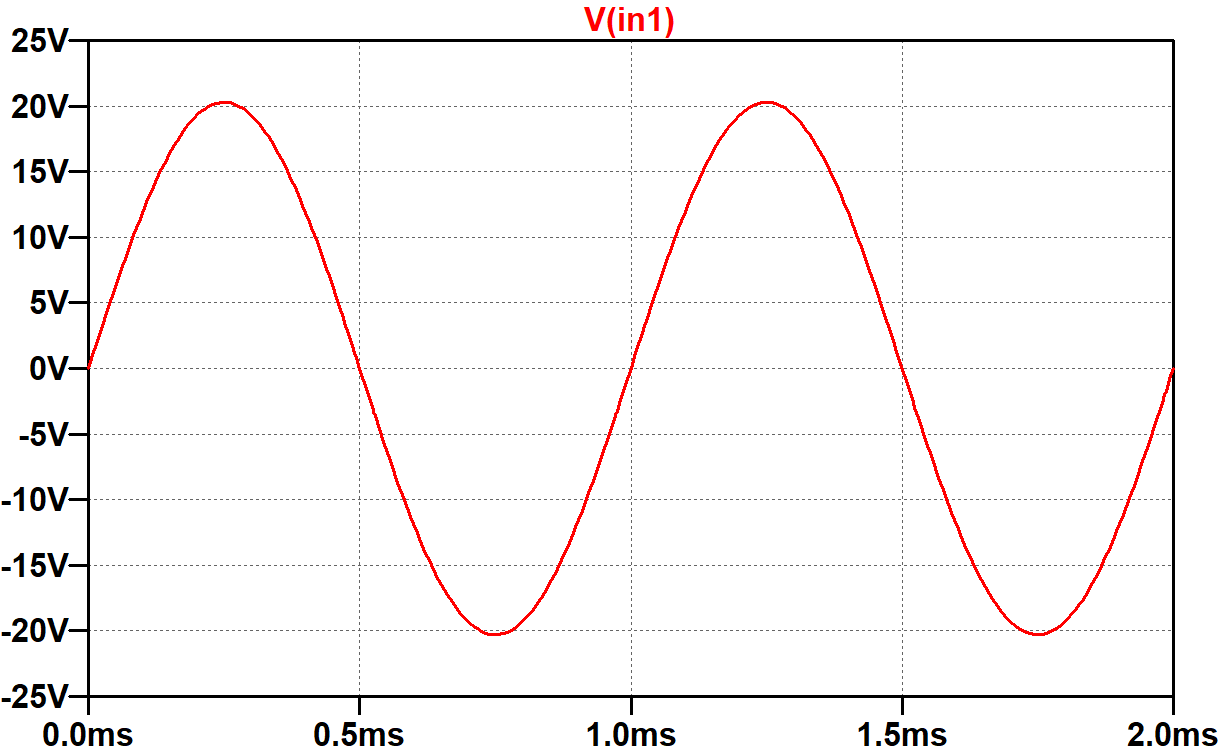
The 20.3V signal amplitude matches the DC cathode voltage, so
the power amp is driven to full power, at least initially.
Node in1 drives a voltage-controlled voltage source with a coefficient "value" of -1 to create an identical signal of opposite phase at node in2.
This mimics the performance of a phase inverter.
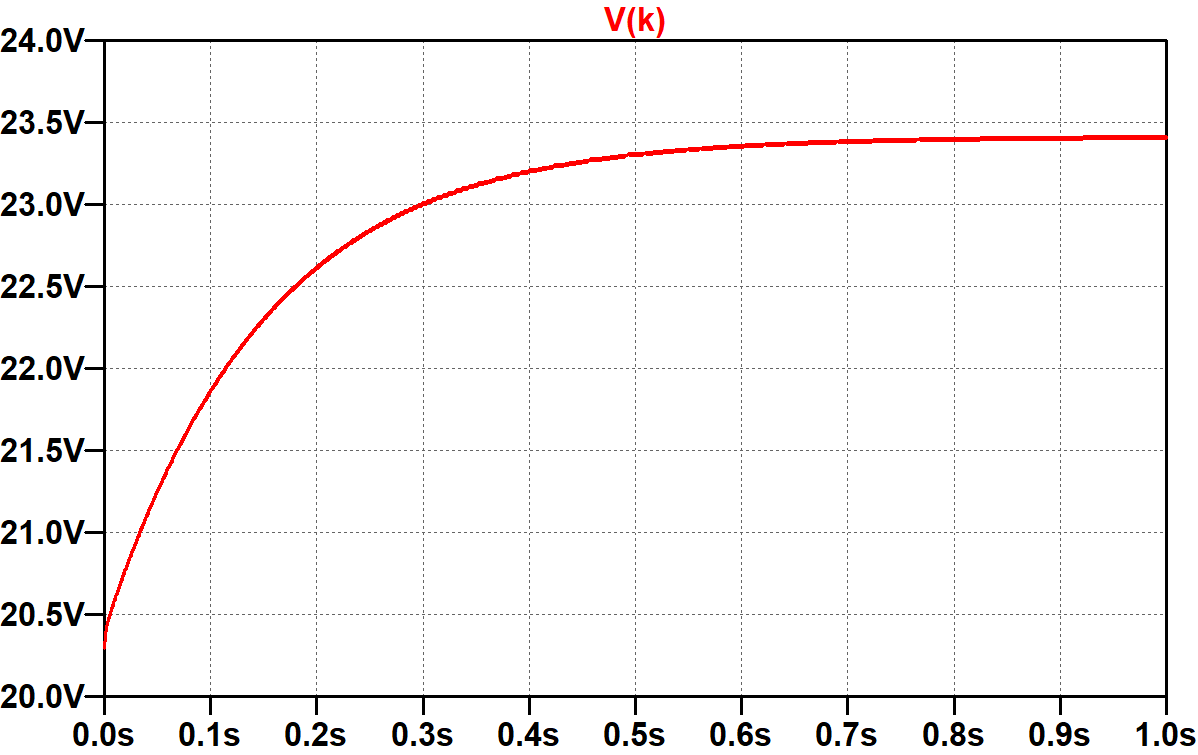
Let's label the cathode node K, alter the
.tran SPICE directive to record the first
500 milliseconds, and plot the cathode voltage.
.tran 500ms
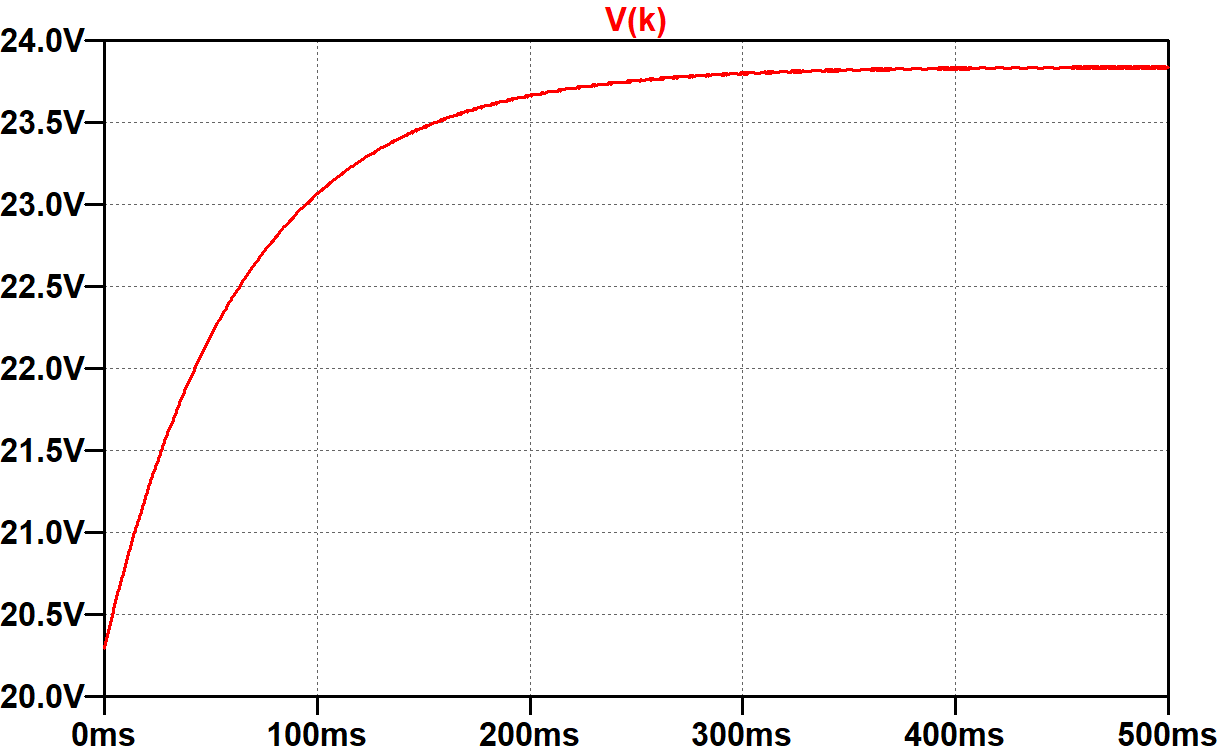
For a Class AB design,3 average plate current and screen current are substantially greater at full power than at idle. This puts more current through the cathode circuit, causing the voltage across it to increase. Even with an extraordinarily large cathode capacitor, it only takes half a second for the voltage to reach its final value of 23.8V. The DC grid bias has effectively decreased to -23.8V, representing bias excursion that puts the Class AB power amp closer to Class B.
For the first few milliseconds the capacitor does a good job at keeping the cathode voltage at 20.3V. Let's execute the following actions to check power amp performance at the speaker:
- alter the
.tranSPICE directive to record the first 2 milliseconds, - rerun the simulation,
- plot the voltage at node
out, - plot the current through the 8Ω speaker resistor, and
- hold down the alt button and click on the resistor to plot instantaneous power.
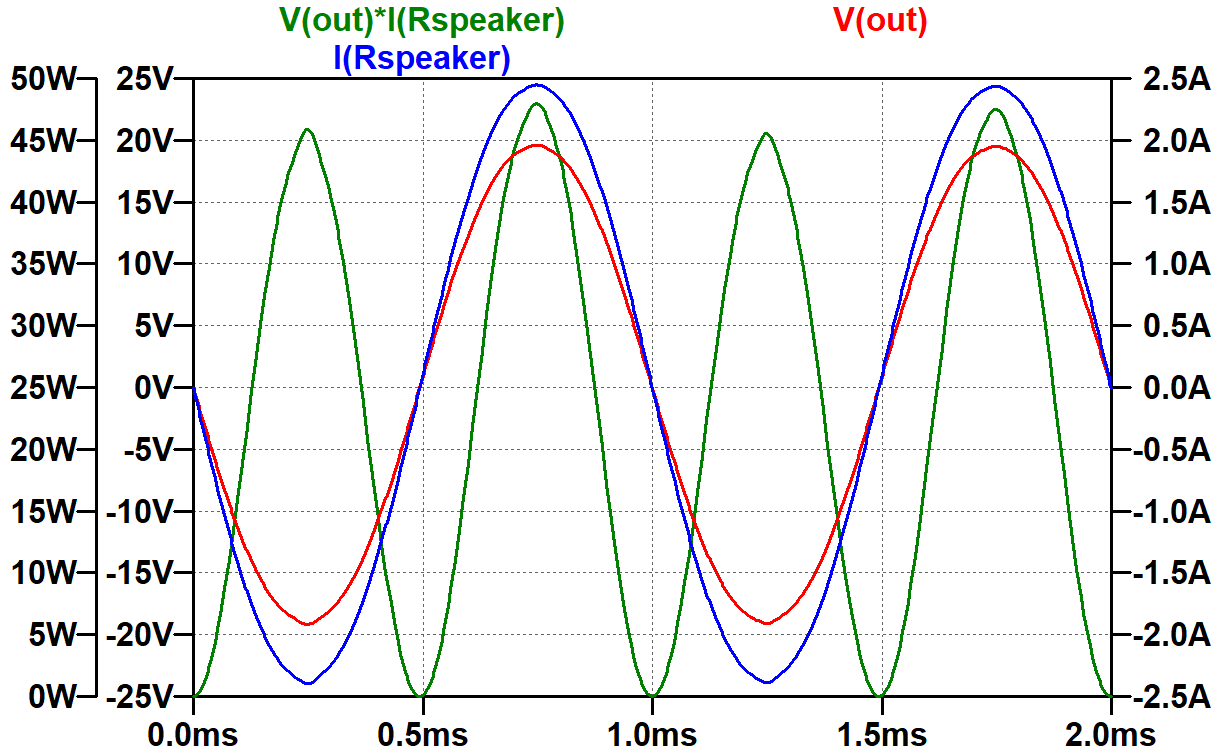
Instantaneous power reaches a maximum of about 46 watts when the voltage and current swing to their positive or negative peaks. When the voltage and current cross zero, instantaneous power is zero. If we hold down the control button and click on the label for instantaneous power "V(out)*I(Rspeaker)" we see that the average power is 23.8 watts.
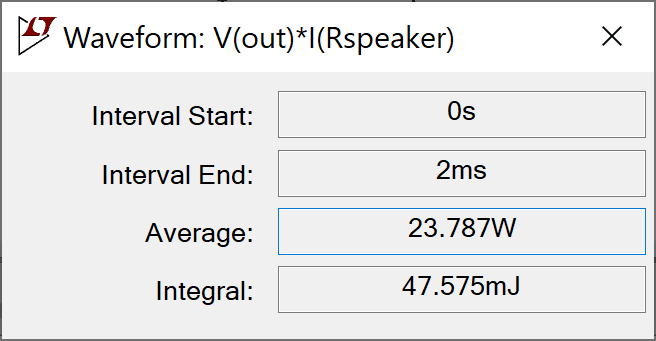
The average is the product of the RMS voltage and RMS current. i.e. 23.8W RMS. This is close to the EA-10's advertised output power of 25W RMS.4
The EA-10 has a 20μF cathode bypass capacitor, much smaller than the 1000μF value that we are using. Let's add the opposite extreme to our model: a 1pF value, essentially no capacitor, leaving the cathode resistor unbypassed. Here's a SPICE directive to step the capacitor through the two values:
.step param C list 1pF 1000uF
The capacitor value is set to the variable {C}.
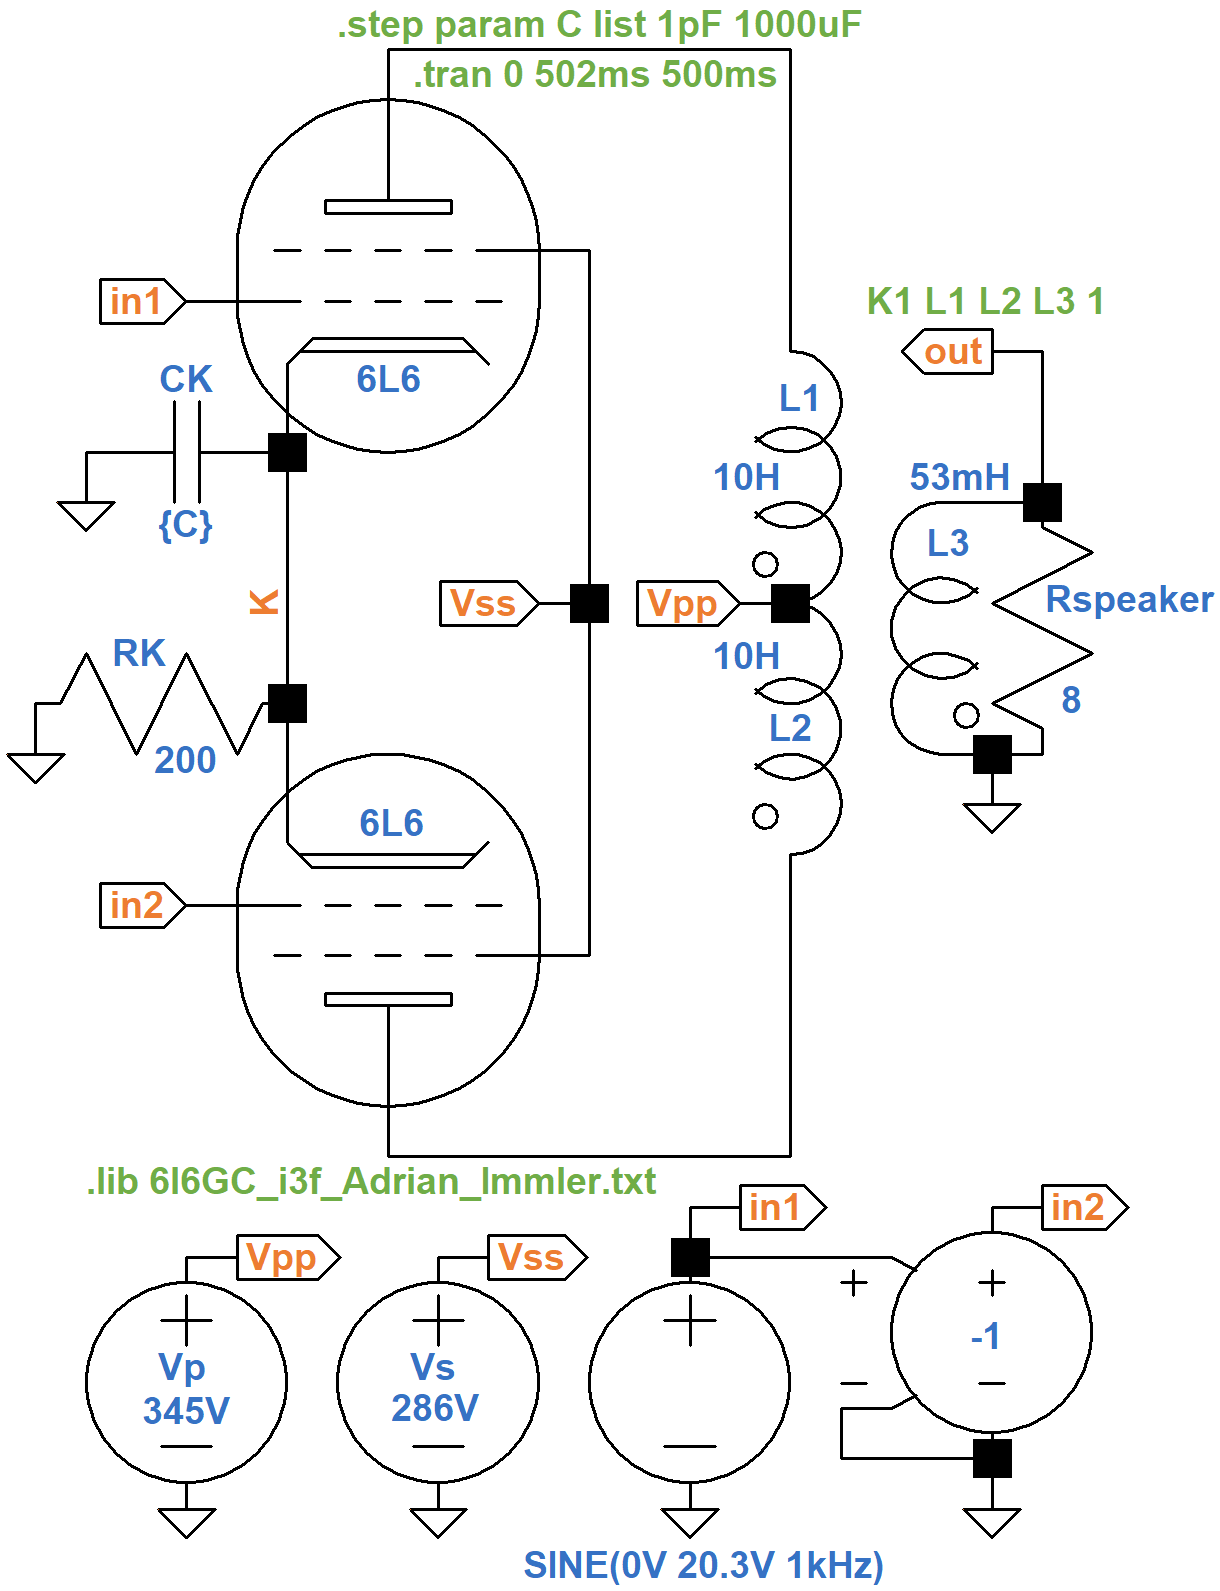
The .tran SPICE directive is set to run for
half a second before two cycles of data are collected.
This allows the 1000μF capacitor voltage to reach a steady-state value.
For the 1pF value the delay has no impact.
Let's plot the speaker voltage.
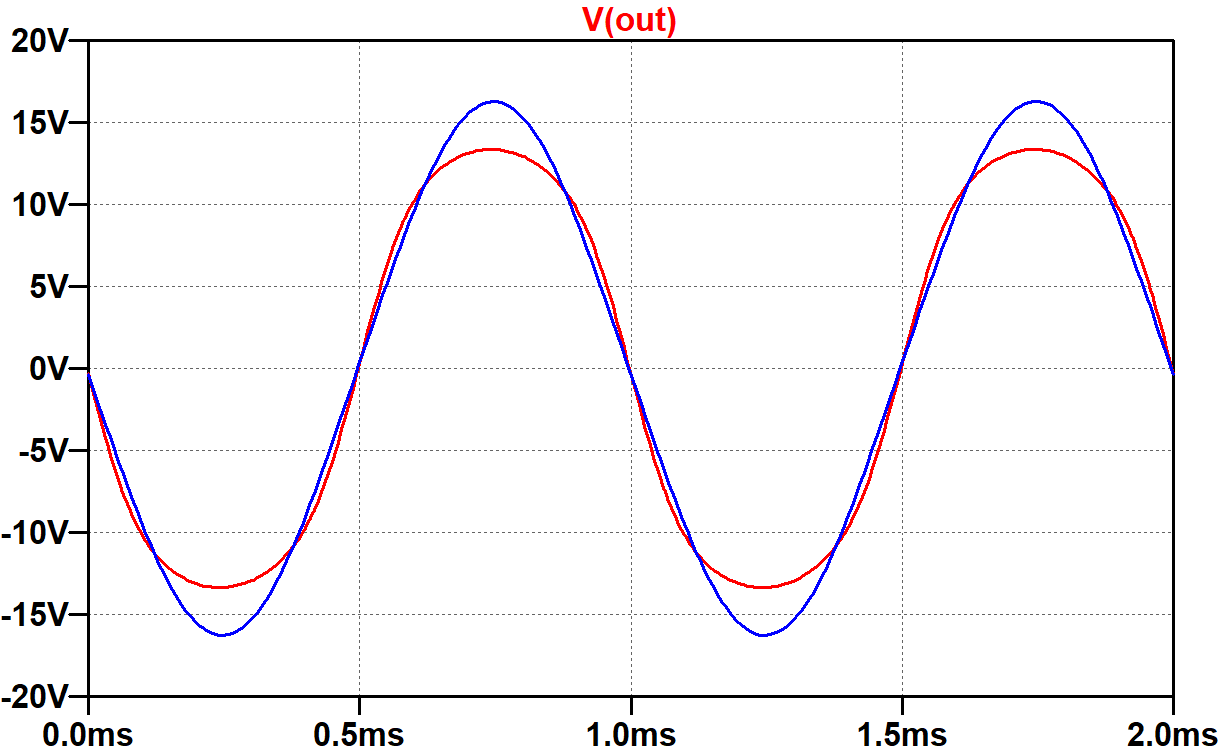
The red trace is for a 1pF capacitor. Compared to the blue trace, which is close to looking like a sine wave, the voltage is visibly squashed at its extremes of swing. Peak-to-peak voltage swing for 1pF is significantly less than for 1000μF.
To quantify the distortion, let's add a SPICE directive to perform Fourier analysis5,6 on the speaker voltage with a 1kHz fundamental:
.four 1kHz V(out)
When we rerun the simulation, make the schematic window active, and select View > SPICE error log, we get the results for harmonic distortion. The first set is for the 1pF capacitor.
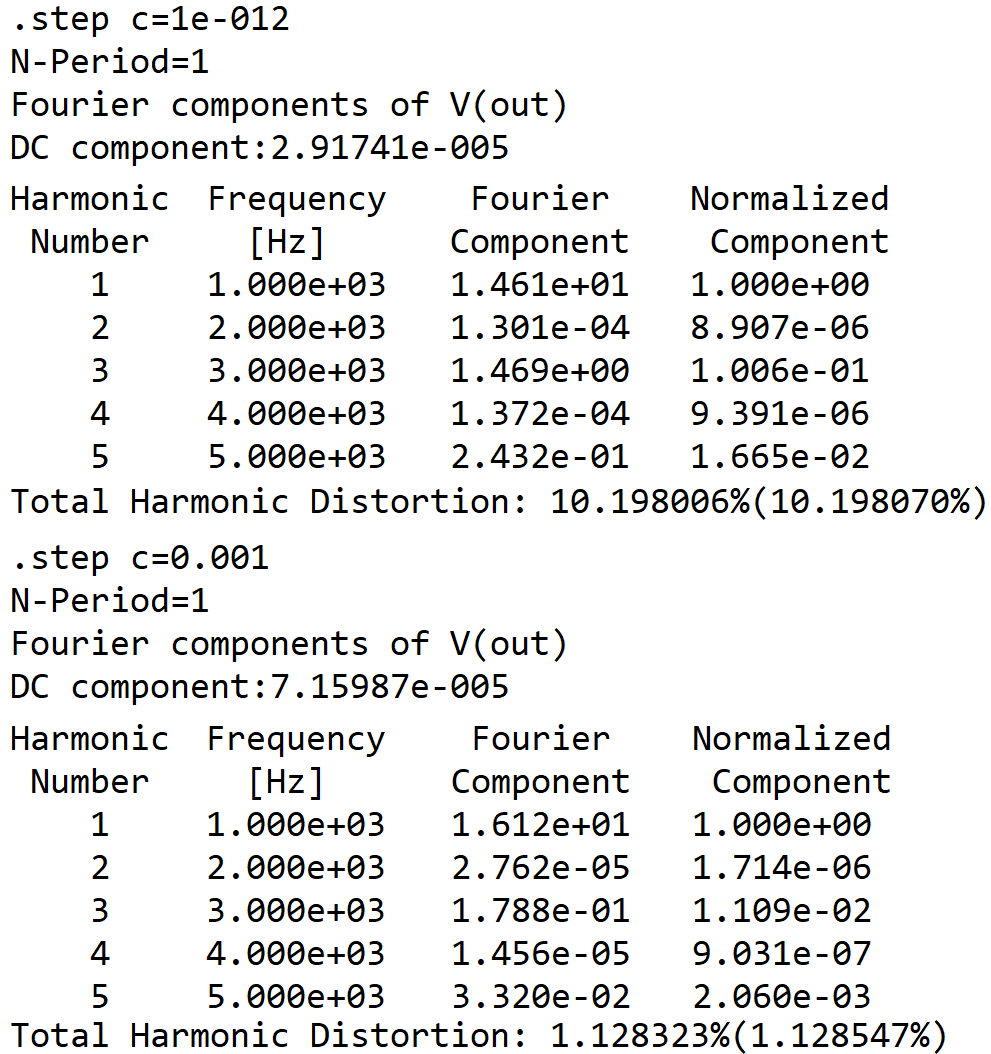
Total harmonic distortion (THD) is 10 percent with a 1pF capacitor, compared to only 1 percent with 1000μF. In both cases, "harmonic number" 3 has the greatest component value because distortion is symmetrical - positive swings are the mirror images of negative swings. The third harmonic dominates in a well-balanced push-pull design. Single-ended power amps produce mostly second-harmonic distortion until overdriven.
To identify the reason for increased distortion without a bypass capacitor, let's plot the cathode voltage.
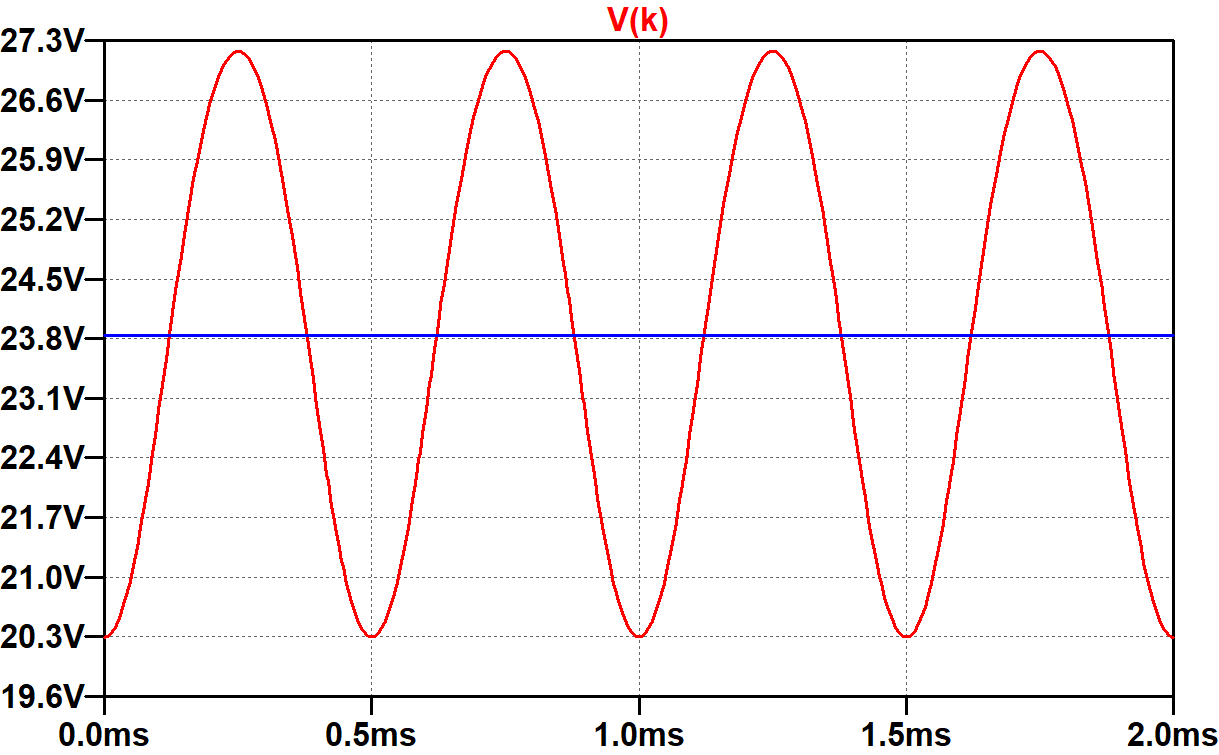
The blue trace shows that the voltage across the 1000μF capacitor has settled to 23.8V. Its large size holds the voltage steady as the audio signal varies. With only 1pF, the cathode voltage swings by almost 7V at a frequency that is double the 1kHz frequency of the input signal. As the input signal crosses 0V, the cathode voltage is 20.3V, equal to its idle DC value. As the input signal voltage swings positive or negative, the total plate and screen current increases, creating a greater voltage drop across the 200Ω cathode resistor, thereby increasing the cathode voltage.
By clicking and holding down the mouse button on node in1,
hovering over node K until the probe-like cursor turns black,
and then releasing the mouse button,
we can plot the grid-to-cathode voltage for the upper tube.
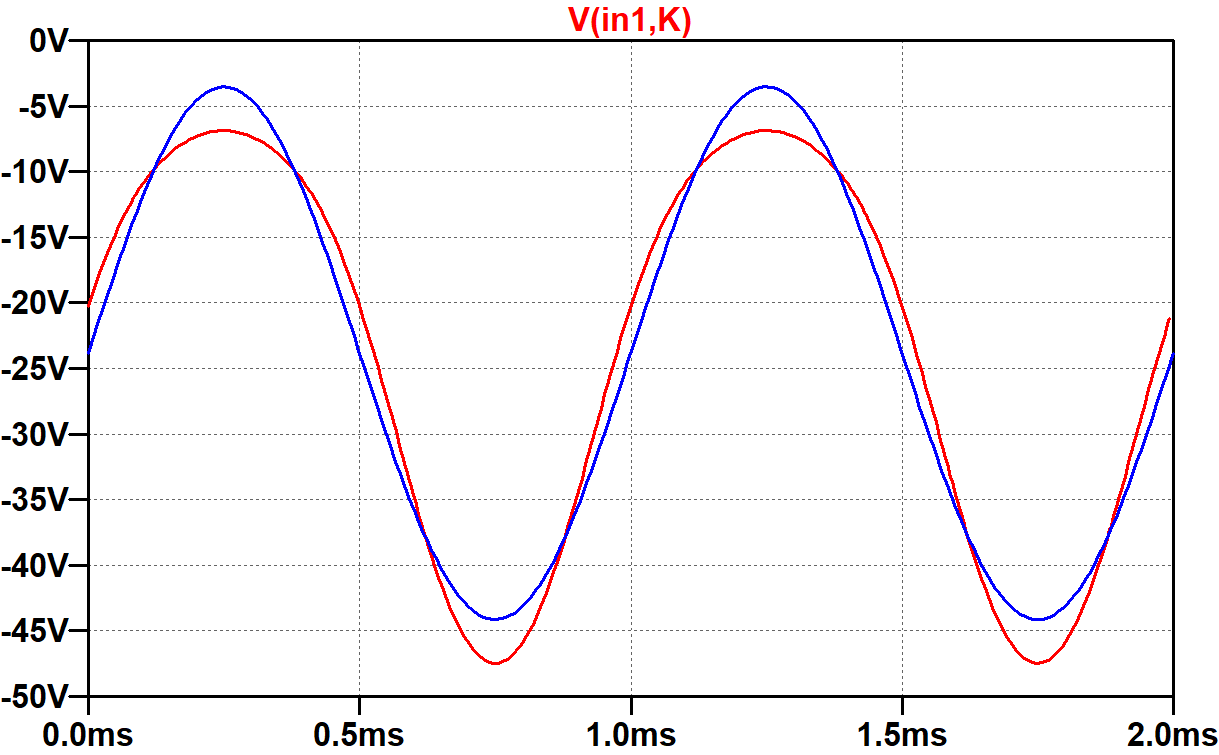
Because the cathode voltage is constant with the 1000μF capacitor, the blue grid-to-cathode voltage has the same shape as the grid-to-ground voltage, which is a perfect sine wave. Without the capacitor, positive peaks are flatter because the cathode voltage reaches a positive peak at the same time that the grid-to-ground voltage reaches a positive peak. Negative swings are sharper for the same reason: the 2kHz cathode voltage swing reaches a positive peak when the grid voltage reaches a negative peak.
If we consider the grid-to-ground voltage to be an input, and the grid-to-cathode voltage to be an output, then allowing the cathode voltage to vary causes positive peaks to have less gain and negative peaks to have more gain.
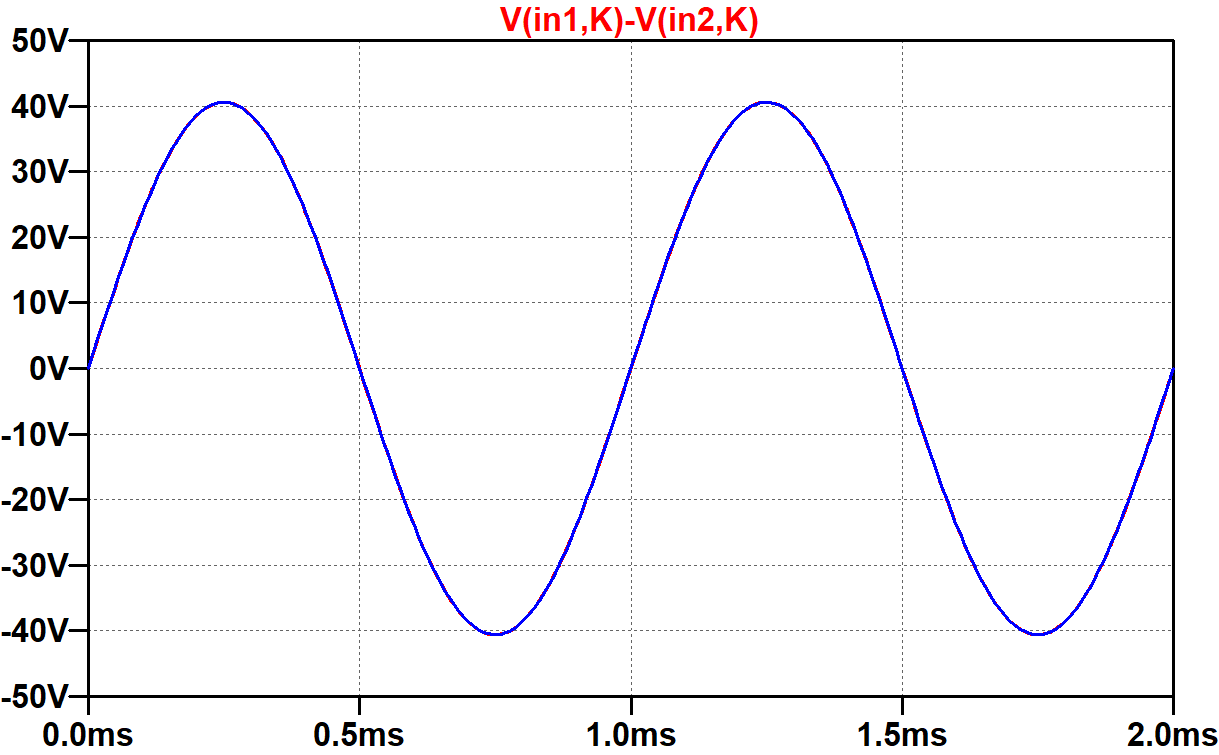
The plot shows the grid-to-cathode voltage for the upper tube, which is just one phase of the signal. For a balanced signal, like the output of a phase inverter, the signal is represented by a voltage difference, in this case the grid-to-ground voltage of one tube minus the grid-to-ground voltage of the other tube:
Vin1 - Vin2
(In fact, this concept forms the basis for the Danelectro differential guitar amp.) Equivalently, the signal is represented by the grid-to-cathode voltage for one tube minus the grid-to-cathode voltage for the other:
(Vin1 - VK) - (Vin2 - VK) = Vin1 - Vin2
If we plot the difference in grid-to-cathode voltages, the results are the same whether the cathode voltage is allowed to vary or remains constant. (Because they are identical, the blue trace shown here obscures the red trace.)
A varying cathode voltage does not matter at the 6L6 inputs, but somehow matters at the speaker output. Let's look at the plate current for the lower tube.
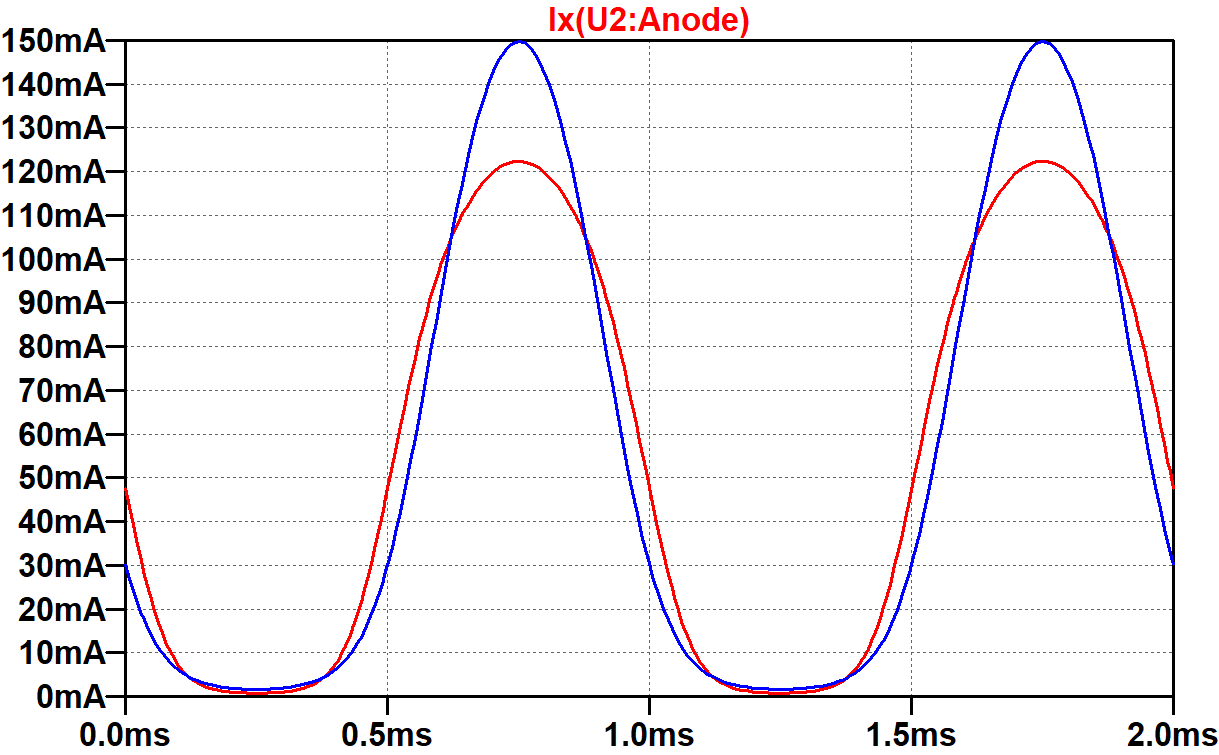
Clearly this is Class AB, because the tube goes into cutoff for a substantial portion of each cycle. With only a 1pF bypass capacitor, the grid-to-cathode voltage for each tube has flattened positive peaks and sharpened negative peaks. If both tubes were to continuously conduct with the same voltage gain, a flattening of the plate current increase in one tube would be offset by a sharpening of the plate current decrease in the opposite tube. When our Class AB tubes go into cutoff, the latter phenomenon cannot occur. All that we get is a flattening of the total current in the transformer primary at both extremes of swing. Sharpening at the input has no effect on the output.
The effect is accentuated when the amp is biased closer to Class B. Then the opposite tube is in cutoff for an entire half cycle. One tube pushes while the other fails to pull. The distortion is reduced, but not eliminated, when the power amp is biased to Class A.
Overdrive Performance - Fully Bypassed Cathode Resistor
The EA-10's power amp is driven by a 12AU7 paraphase phase inverter with a relatively low output impedance: 7kΩ. It drives 220kΩ grid-leak resistors via 0.047μF coupling capacitors. These factors are important to the power amp's response when overdriven.
Here the input signal amplitude is increased to 40V peak, putting the power amp well into overdrive.
Even with a huge 1000μF value, it only takes a second for the cathode voltage to settle to 23.4V.
Here are two cycles of the speaker voltage after delaying data collection for 1 second to allow the cathode voltage to settle.
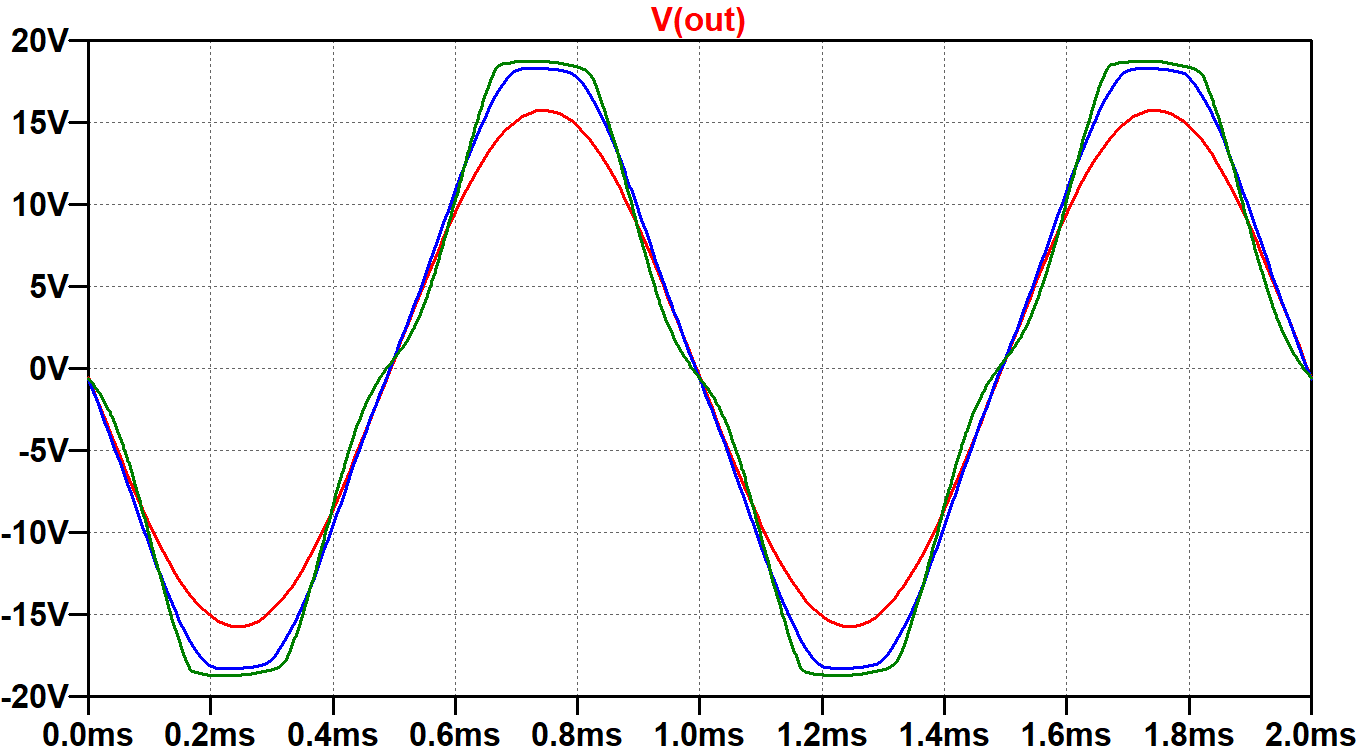
This time the input signal is stepped through 3 levels: 20V (underdrive), 28V (mild overdrive), and 40V (overdrive). With a 40V input (green trace), there is visible crossover distortion as the voltage, for example, increases from -5V to +5V, indicating that the power amp is operating close to Class B. Here, for example, is what the output looks like when crossover distortion is severe. (The input amplitude is 60V.)
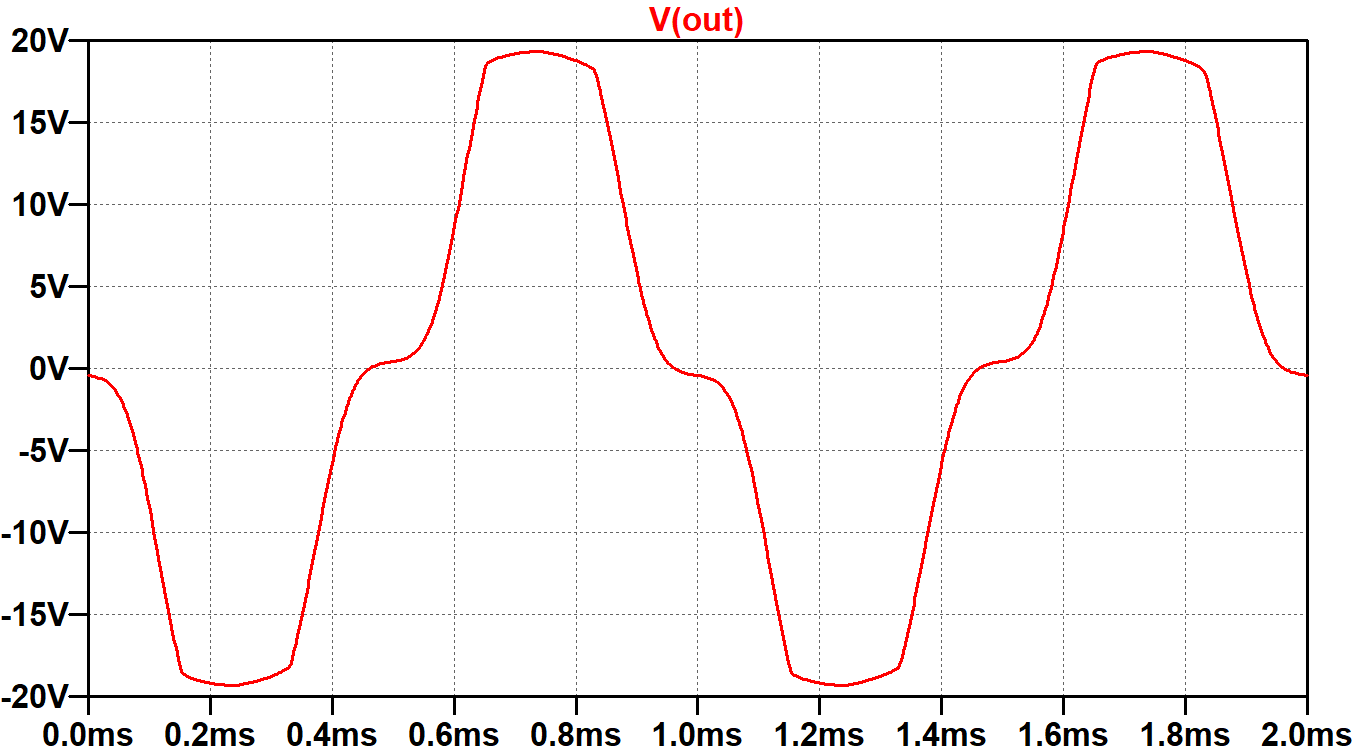
When the signals at the grids cross 0V, one tube takes over as the main contributor to current in the transformer primary. The opposite tube gives up that role. If biased too coldly, both tubes are in cutoff as the transition occurs, causing crossover distortion.
At the crossover point, the grids are (presumably?!) at 0V, the cathode voltage has reached a steady state of 23.4V, and the screens are at 286V, for a screen-to-cathode voltage of 263V. According to the transfer characteristics, plate current should be at least 34mA per tube (red dot).
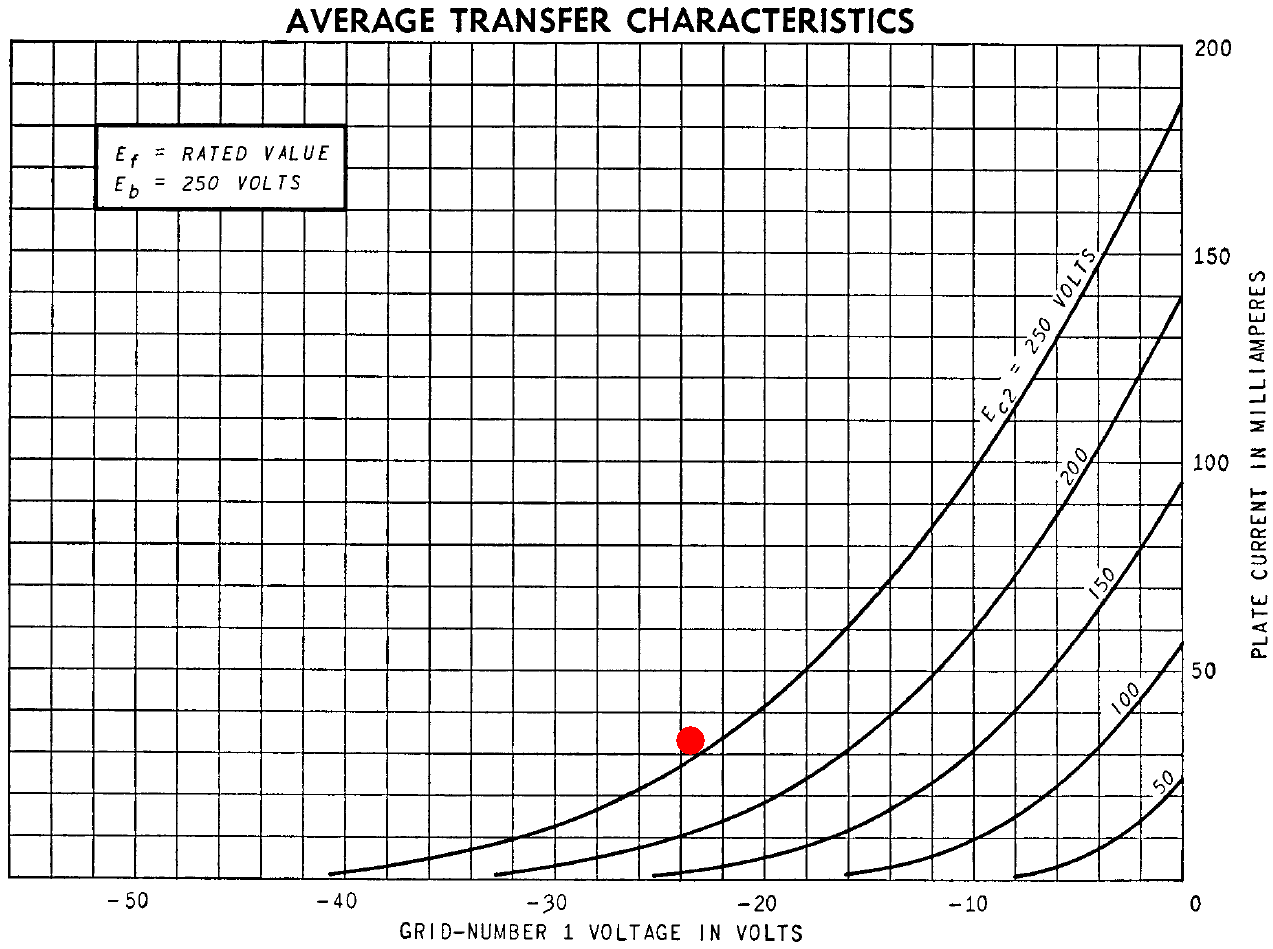
Our plate voltage is higher than the 250V used for the graph, so we should (presumably?!) get a bit more than 34mA. A plot of the total plate current for both tubes tells a different story.
The green trace reaches a minimum of about 10mA, which is 5mA per tube. This is much less than the 34mA or more that we presumed.
The reason for the discrepancy is revealed if we plot the voltage across one of the 0.047μF coupling capacitors. Here is the upper capacitor.
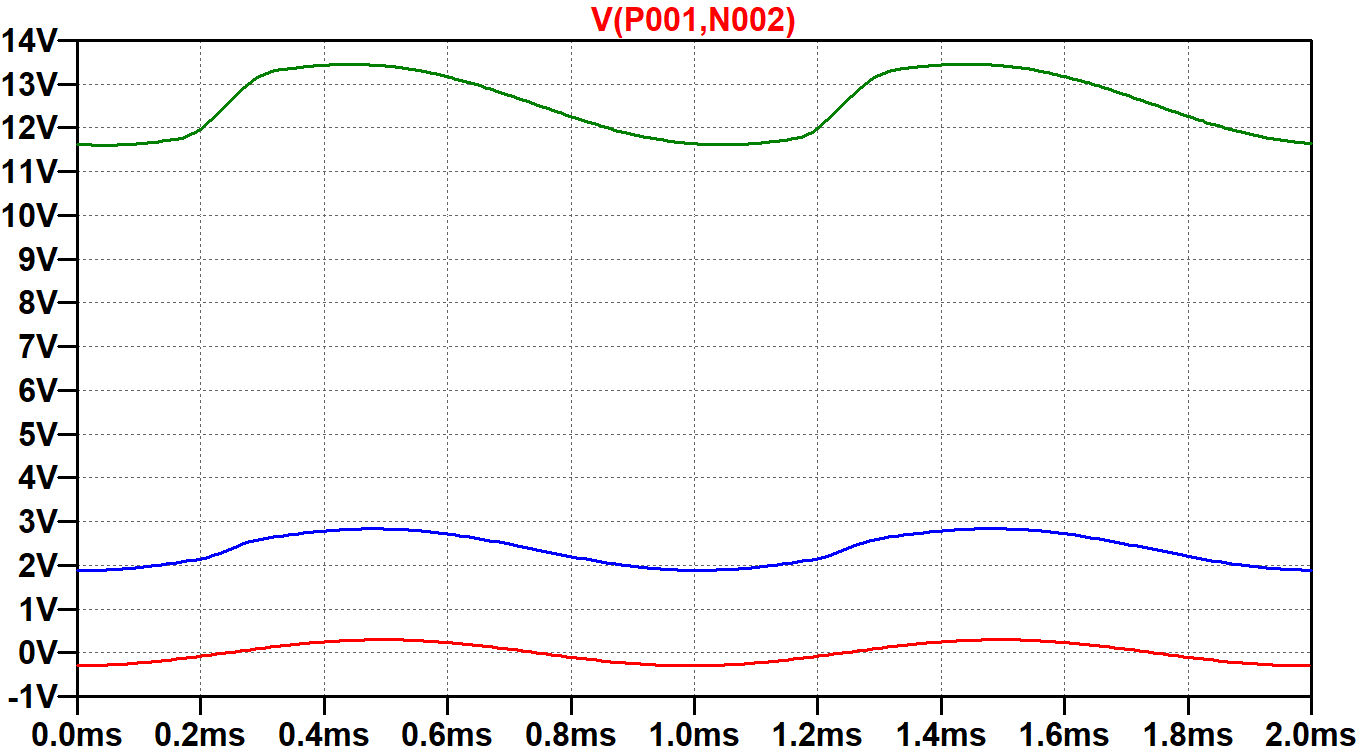
Our presumption of 0V grids is correct for underdrive (red trace). The capacitor charges and discharges slightly during each cycle of the audio signal but maintains 0VDC relative to ground to ensure that the DC grid bias depends solely on the capacitor voltage: -23.4V. Power tube grid current flows during overdrive, causing the capacitor to charge more in one direction than the other until a new equilibrium is reached. For the upper green trace, the capacitor has charged to a steady-state of about 12.5V, making the effective grid bias
-23.4V - 12.5V = -35.9V.
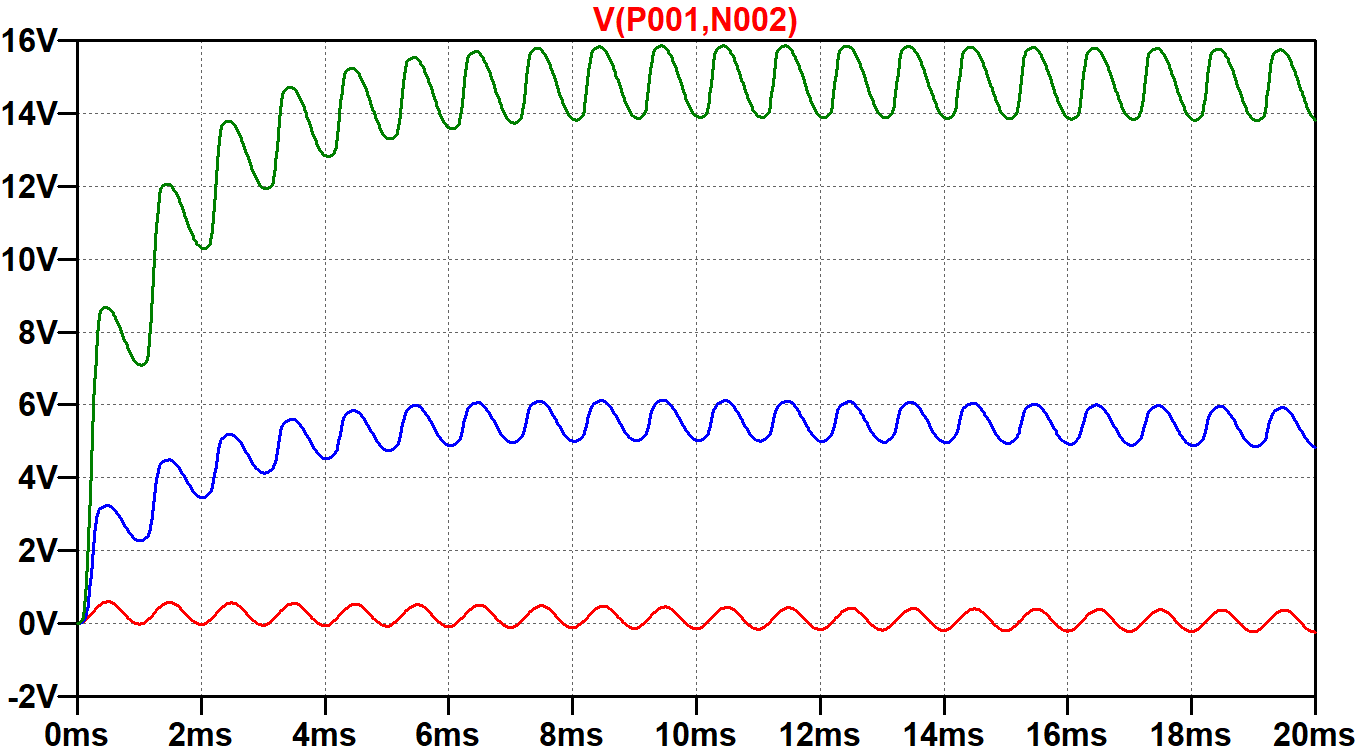
We have therefore witnessed two forms of bias excursion7,8 in this circuit: one caused by the cathode capacitor and the other caused by the coupling capacitors. When the overdrive signal is first applied, the cathode capacitor takes a full second to reach a steady state. The coupling capacitors are much smaller. If we eliminate the simulation's 1-second delay and instead start the plot at time zero, we see that it only takes about 10 milliseconds for the coupling capacitors to reach a steady state.
Overdrive Performance - Unbypassed Cathode Resistor
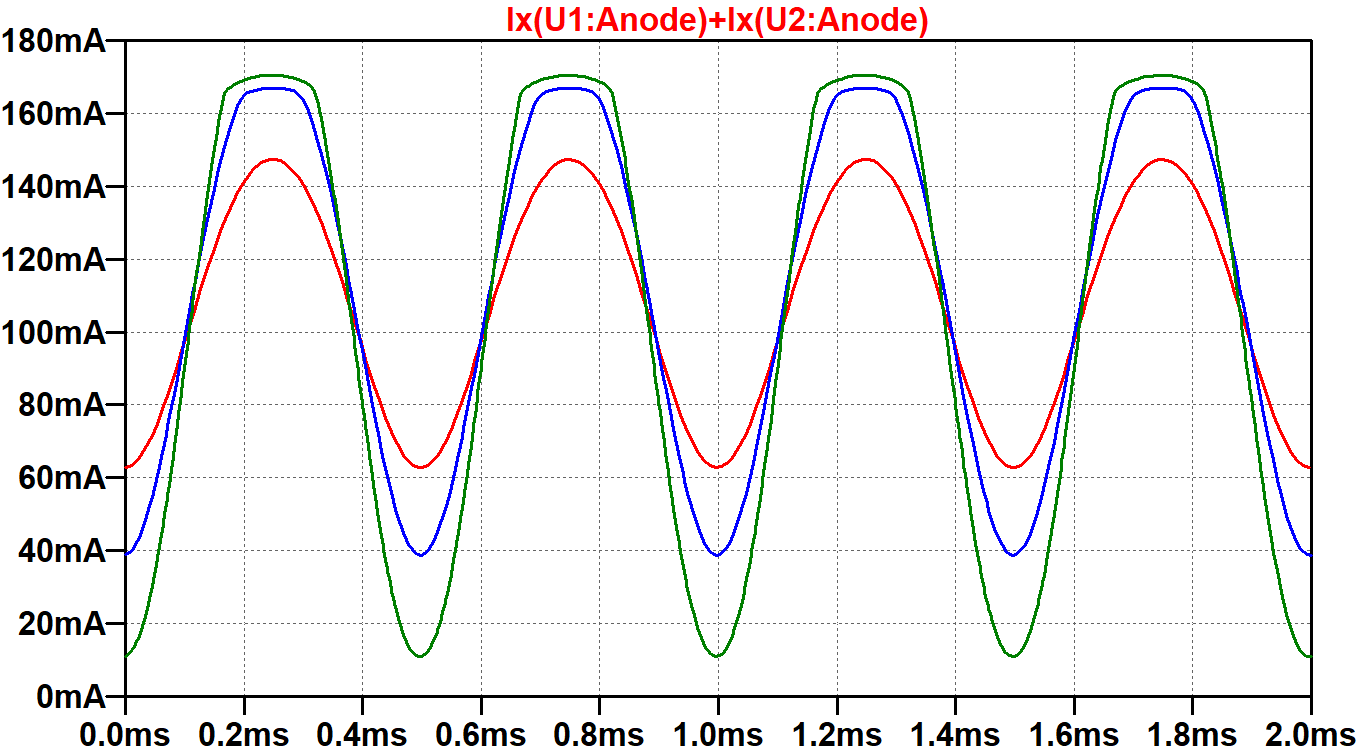
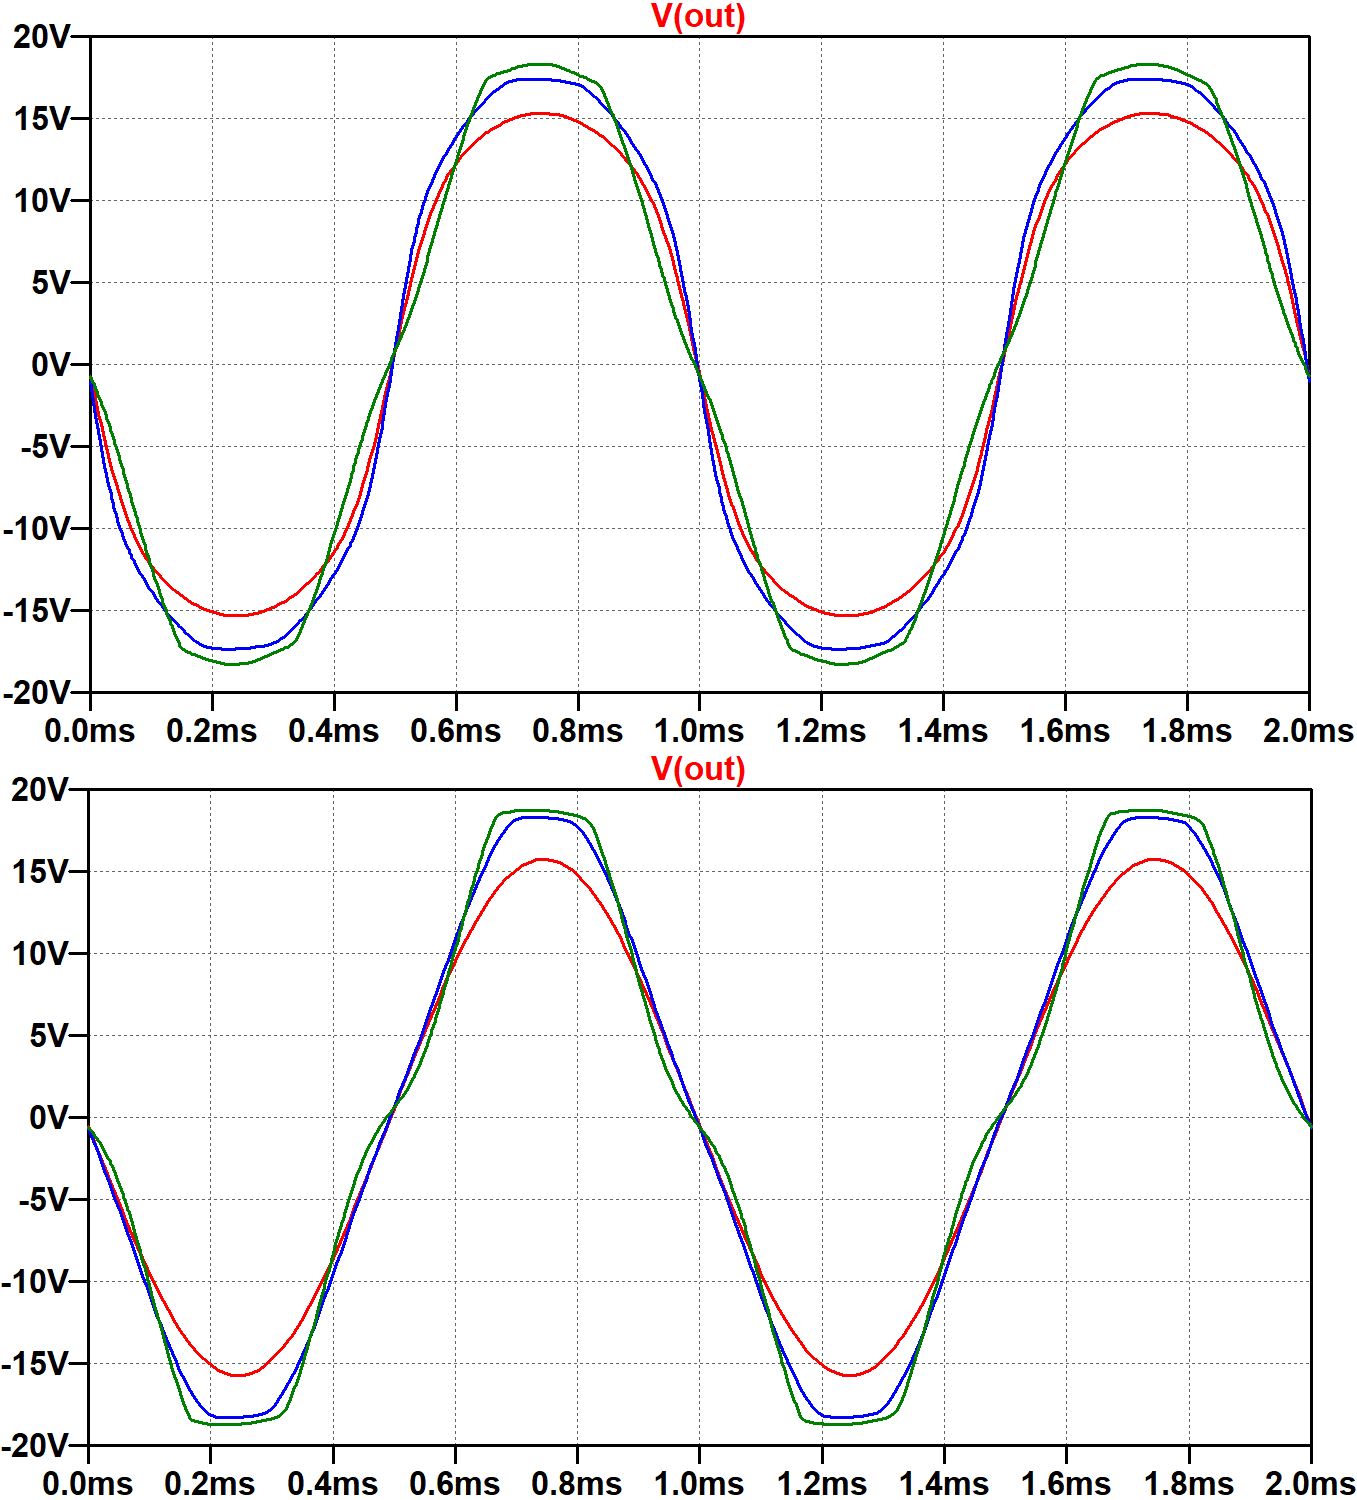
Let's eliminate the cathode bypass capacitor and allow the cathode voltage to increase substantially as the input voltages approach positive and negative peaks. Because the cathode voltage works against the increase in grid voltage it takes a substantially larger grid voltage swing to achieve full power: 39V peak. To get approximately the same underdriven, mildly overdriven, and overdriven states, let's step the signal amplitudes through 28V, 42V, and 90V.
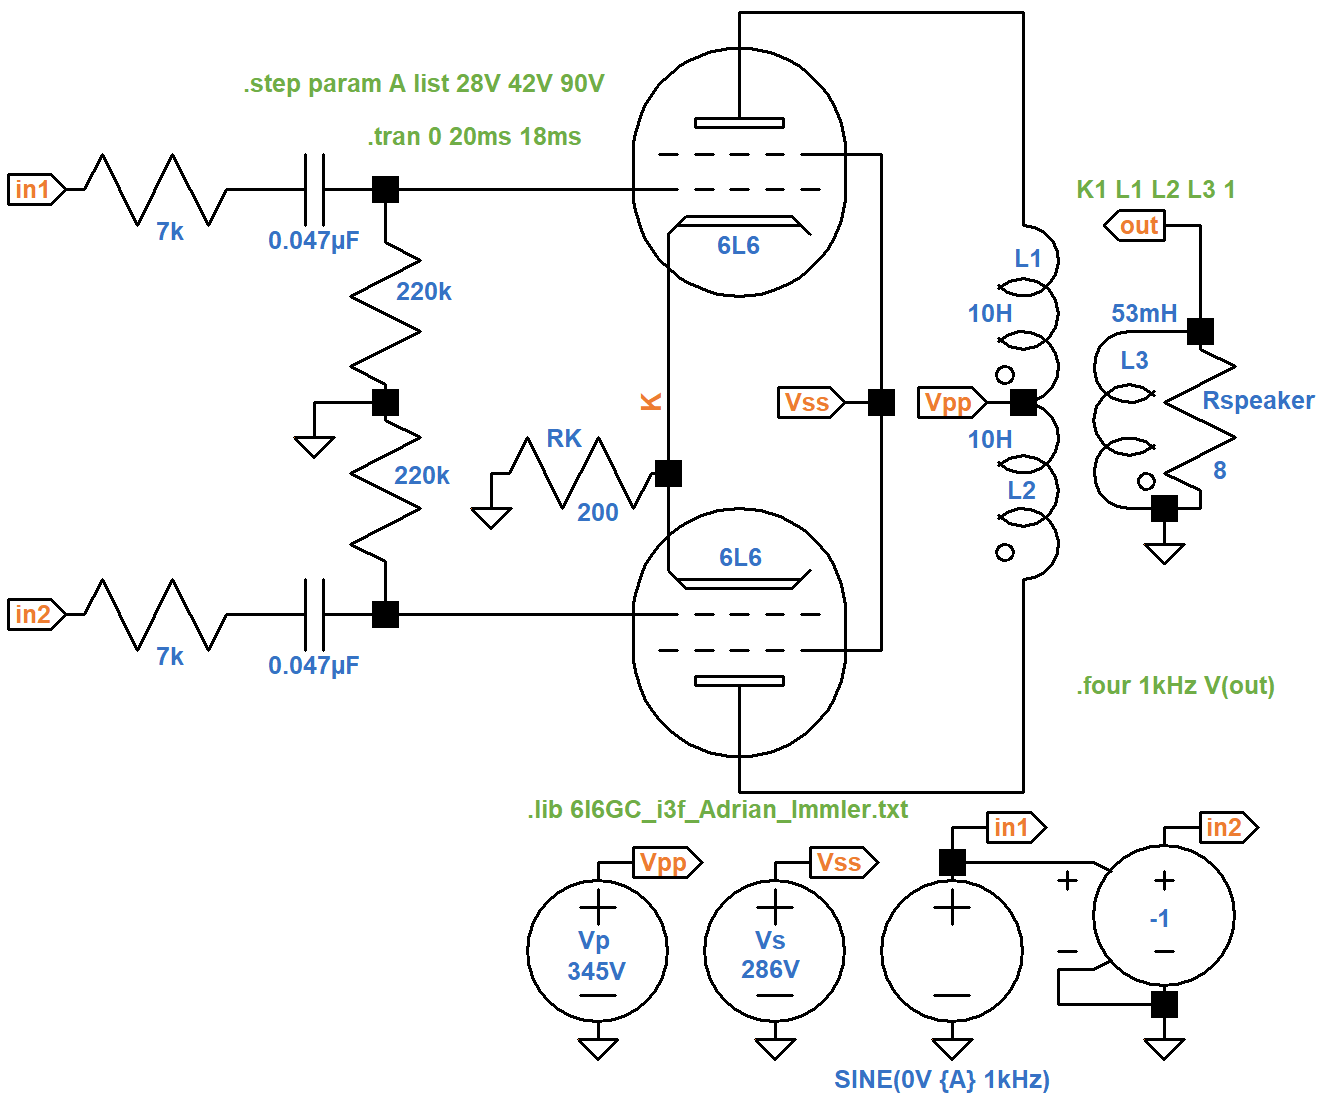
The upper plot shown below has the new traces for an ubypassed cathode resistor. The lower plot is for the 1000μF capacitor shown earlier for input signal amplitudes of 20V, 28V, and 40V.
Here are the Fourier analysis results for the fully bypassed cathode, this time exported to a spreadsheet.
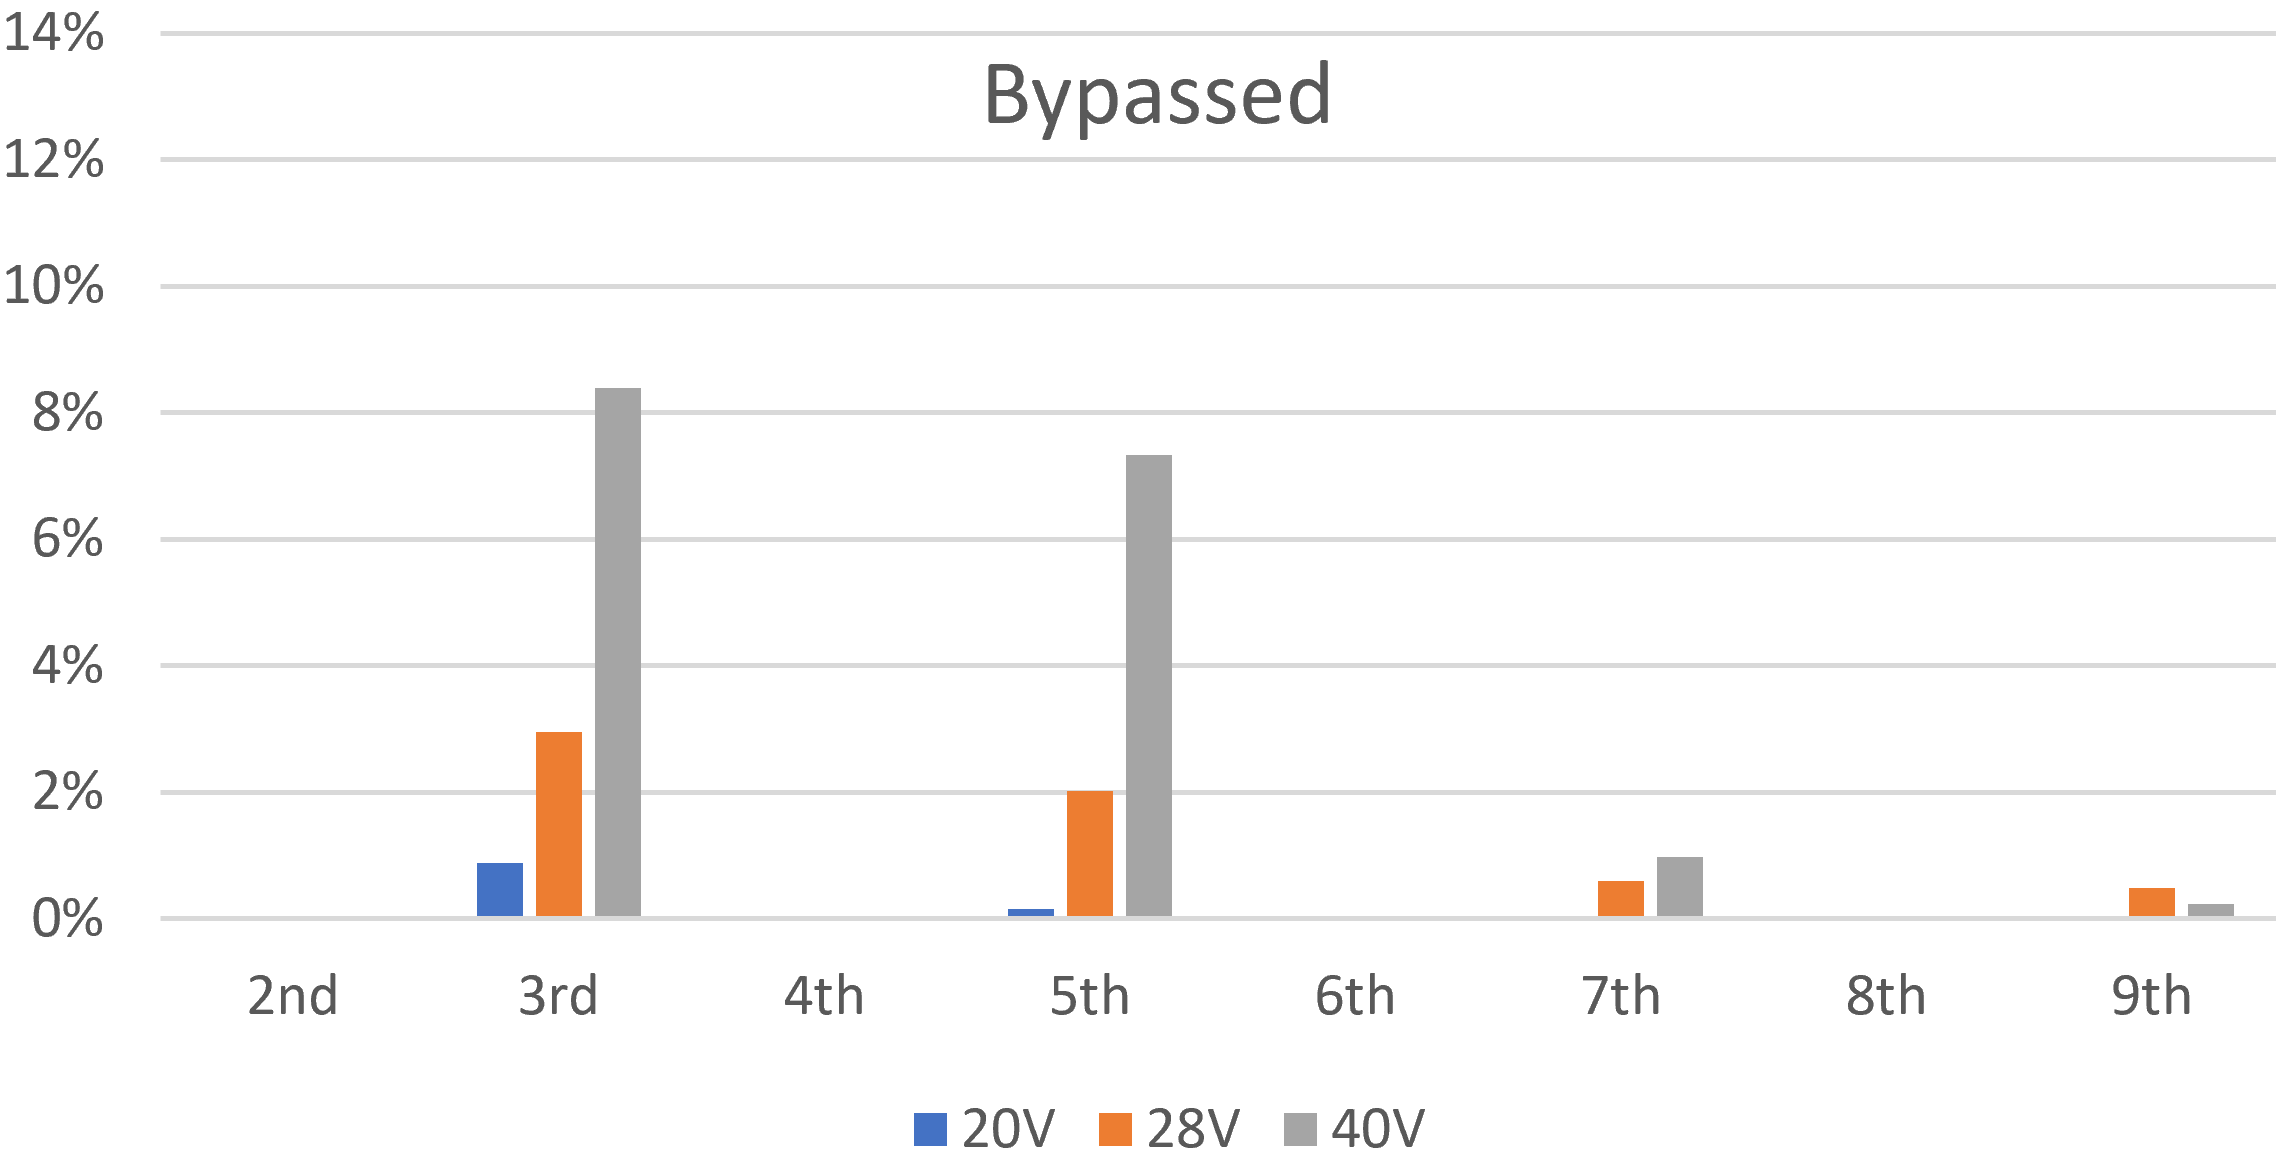
The X axis labels the harmonic numbers. The Y axis depicts the normalized component expressed as a percentage. For a 20V input (blue bars), the amp runs very clean with less than 1-percent third harmonic distortion and negligible fifth, seventh, and ninth. Odd harmonics increase as the power amp is increasingly overdriven, with mostly the third harmonic but with the fifth not far behind. From a guitar player's perspective, the guitar amp runs clean up to full power and then breaks into distortion as the amp is overdriven.
The situation is entirely different when the cathode bypass capacitor is removed.
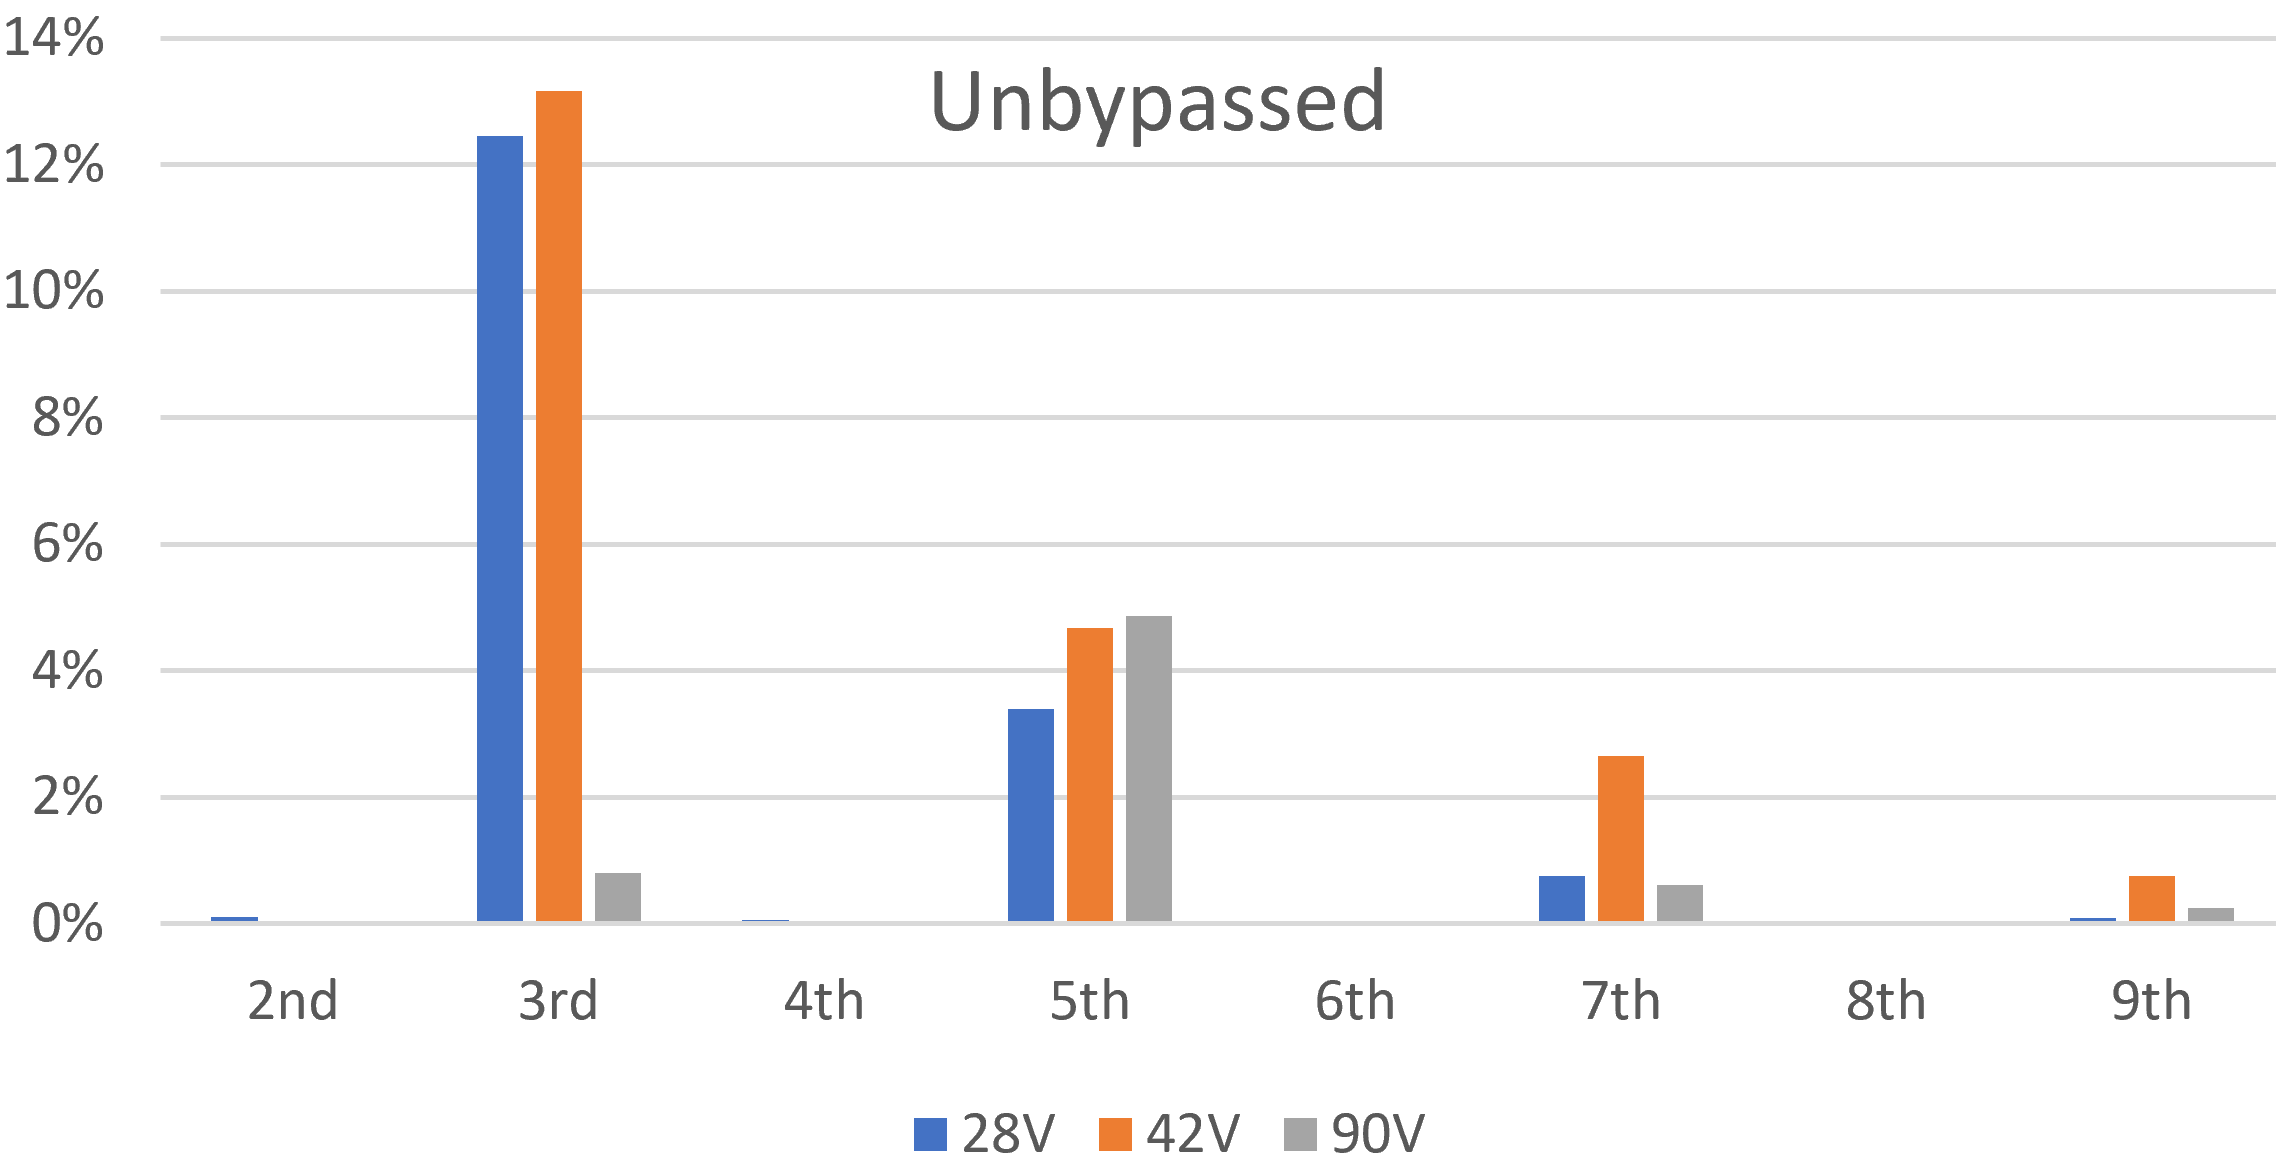
There is more than 12-percent third-harmonic distortion with a 28V input, when the amp is at less than full power. When the amp is moderately overdriven by a 42V signal, distortion barely increases. When severely overdriven, distortion actually decreases! At any power level the third harmonic dominates the fifth. If we could dial in the same total harmonic distortion (THD) for the bypassed and unbypassed amps, they would still sound different because of the differences in harmonic mix.
For another perspective, let's run Fourier analysis for a whole bunch of signal levels both above and below full power. Here is a plot of THD versus input signal amplitude.
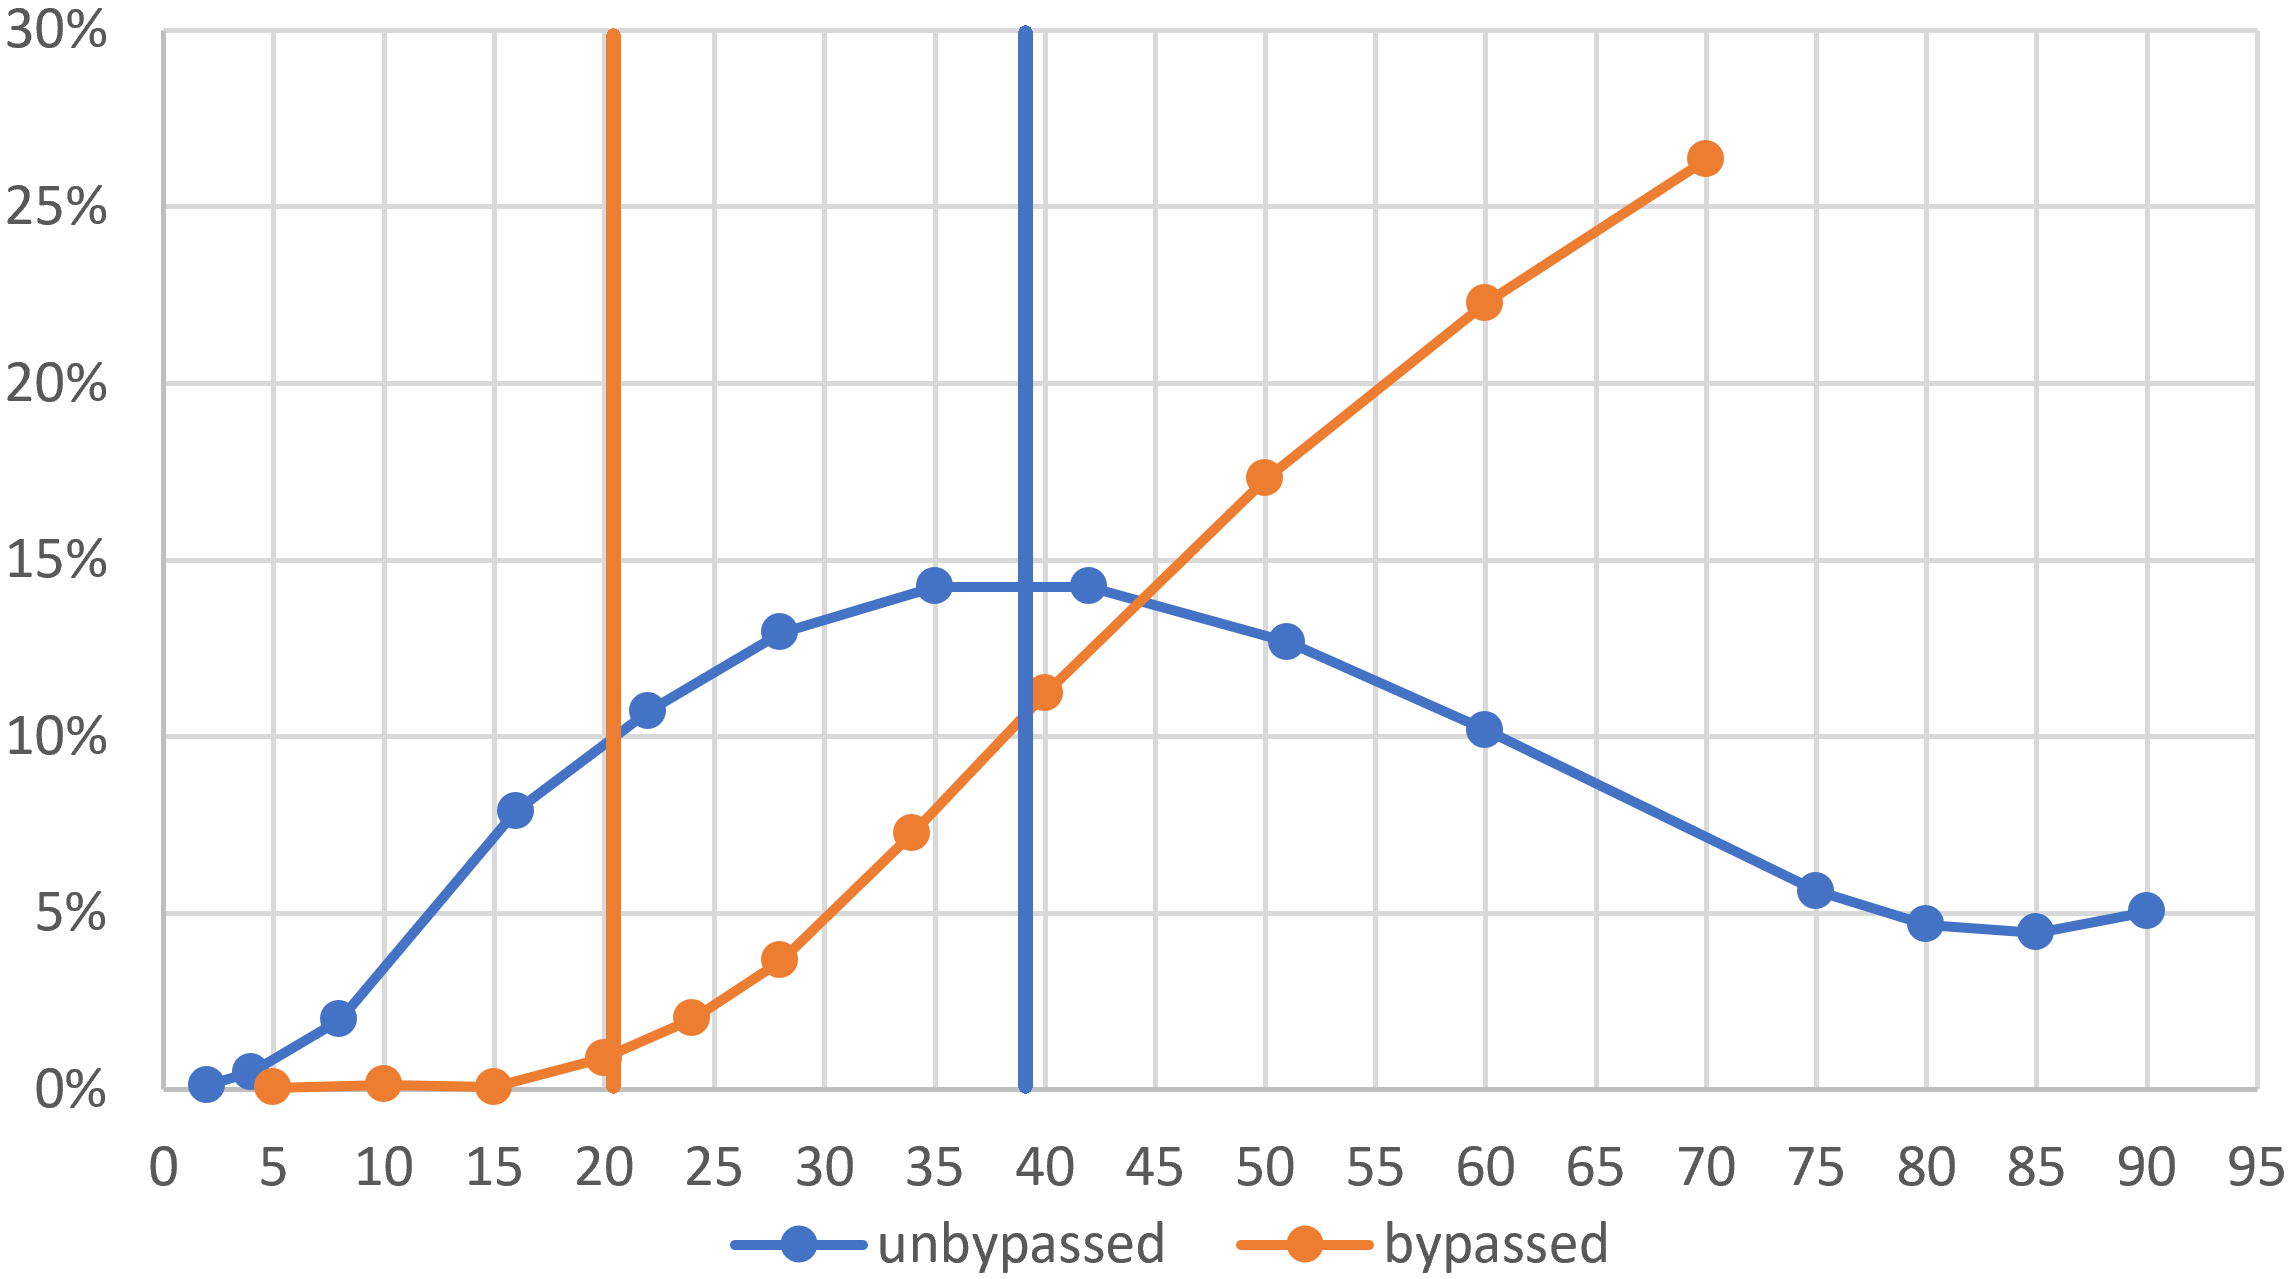
The vertical lines mark the input signal amplitude for full power, before bias excursion has a chance to kick in.
When the cathode resistor is fully bypassed, the dynamic response is typical for a push-pull guitar amplifier: squeaky clean up to full power and then a steady rise in harmonic distortion as the amp is increasingly overdriven. Without the bypass capacitor, distortion is substantial at low signal levels. It plateaus at full power and decreases in overdrive. This represents novelty-item performance, not the behavior expected of a guitar amp.
Epiphone Deluxe EA-10 Cathode Bypass Capacitor
The Epiphone bypass capacitor value is neither 1pF nor 1000μF, which represent extreme values. Its 20μF value is least effective at low frequencies. Let's examine the performance of the capacitor at the lowest note on a guitar with standard tuning: 82Hz. Here is the cathode voltage for a 20.3V 82Hz signal.
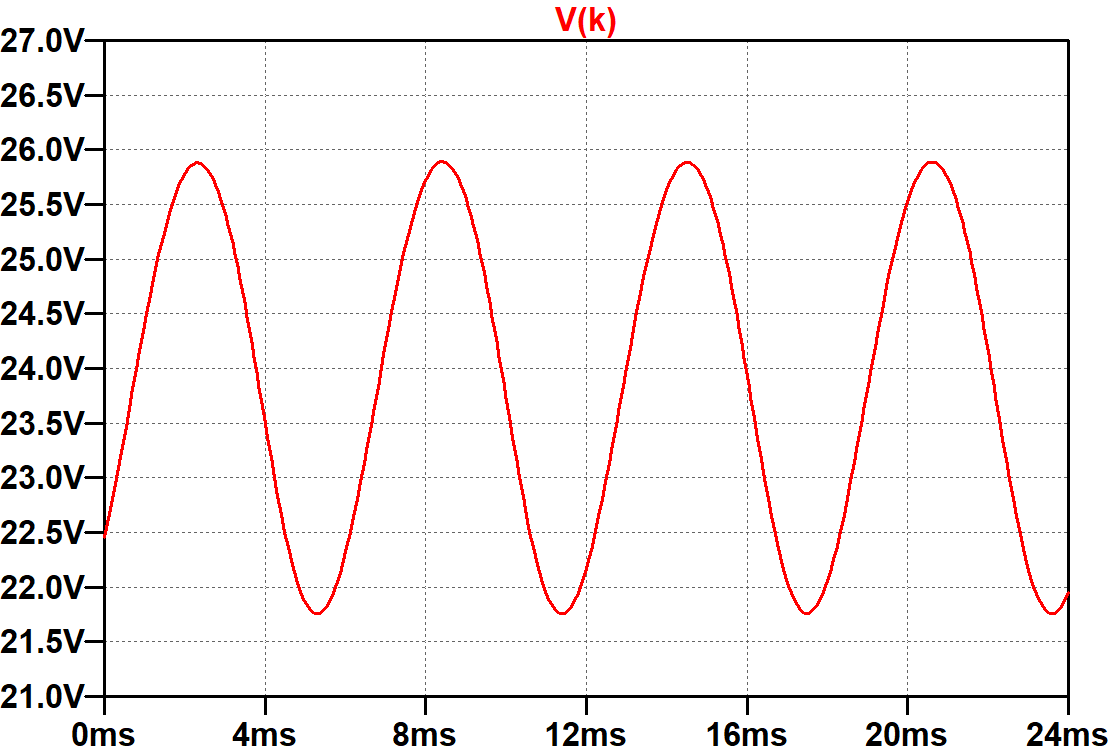
Peak-to-peak voltage swing at 82Hz is about 4V, compared to about 7V when unbypassed. Fourier analysis for an 82Hz fundamental shows that THD is 5.3 percent.
In conclusion, our SPICE simulations demonstrate that the cathode bypass capacitor does not affect bass cut, as it does for a single-ended design, so setting its value should not be postponed to the voicing phase of system design.9 To the contrary, it is an essential part of the distortion profile of the amplifier. The capacitor value needs to be large enough to prevent undesired overdrive behavior.
References
1Richard Kuehnel, Guitar Amplifier Electronics: Circuit Simulaton, (Seattle: Amp Books, 2019), pp. 25-26.
2Richard Kuehnel, Guitar Amplifier Electronics: Circuit Simulaton, (Seattle: Amp Books, 2019), pp. 46-47.
3Richard Kuehnel, Guitar Amplifier Electronics: Basic-Theory, (Seattle: Amp Books, 2018), pp. 114-117.
4Unofficial Epiphone Wiki. Available at http://www.epiphonewiki.org/index/Deluxe_EA-10.php (Retrieved May 25, 2020)
5Richard Kuehnel, Guitar Amplifier Electronics: Basic-Theory, (Seattle: Amp Books, 2018), pp. 170-177.
6Richard Kuehnel, Guitar Amplifier Electronics: Circuit Simulaton, (Seattle: Amp Books, 2019), pp. 139-145.
7Richard Kuehnel, Guitar Amplifier Electronics: Basic-Theory, (Seattle: Amp Books, 2018), pp. 166-170.
8Richard Kuehnel, Guitar Amplifier Electronics: Circuit Simulaton, (Seattle: Amp Books, 2019), pp. 191-195.
9Richard Kuehnel, Fundamentals of Guitar Ampliier System Design, (Seattle: Amp Books, 2019), pp. 114-131.