Fender Bassman Tone Stack
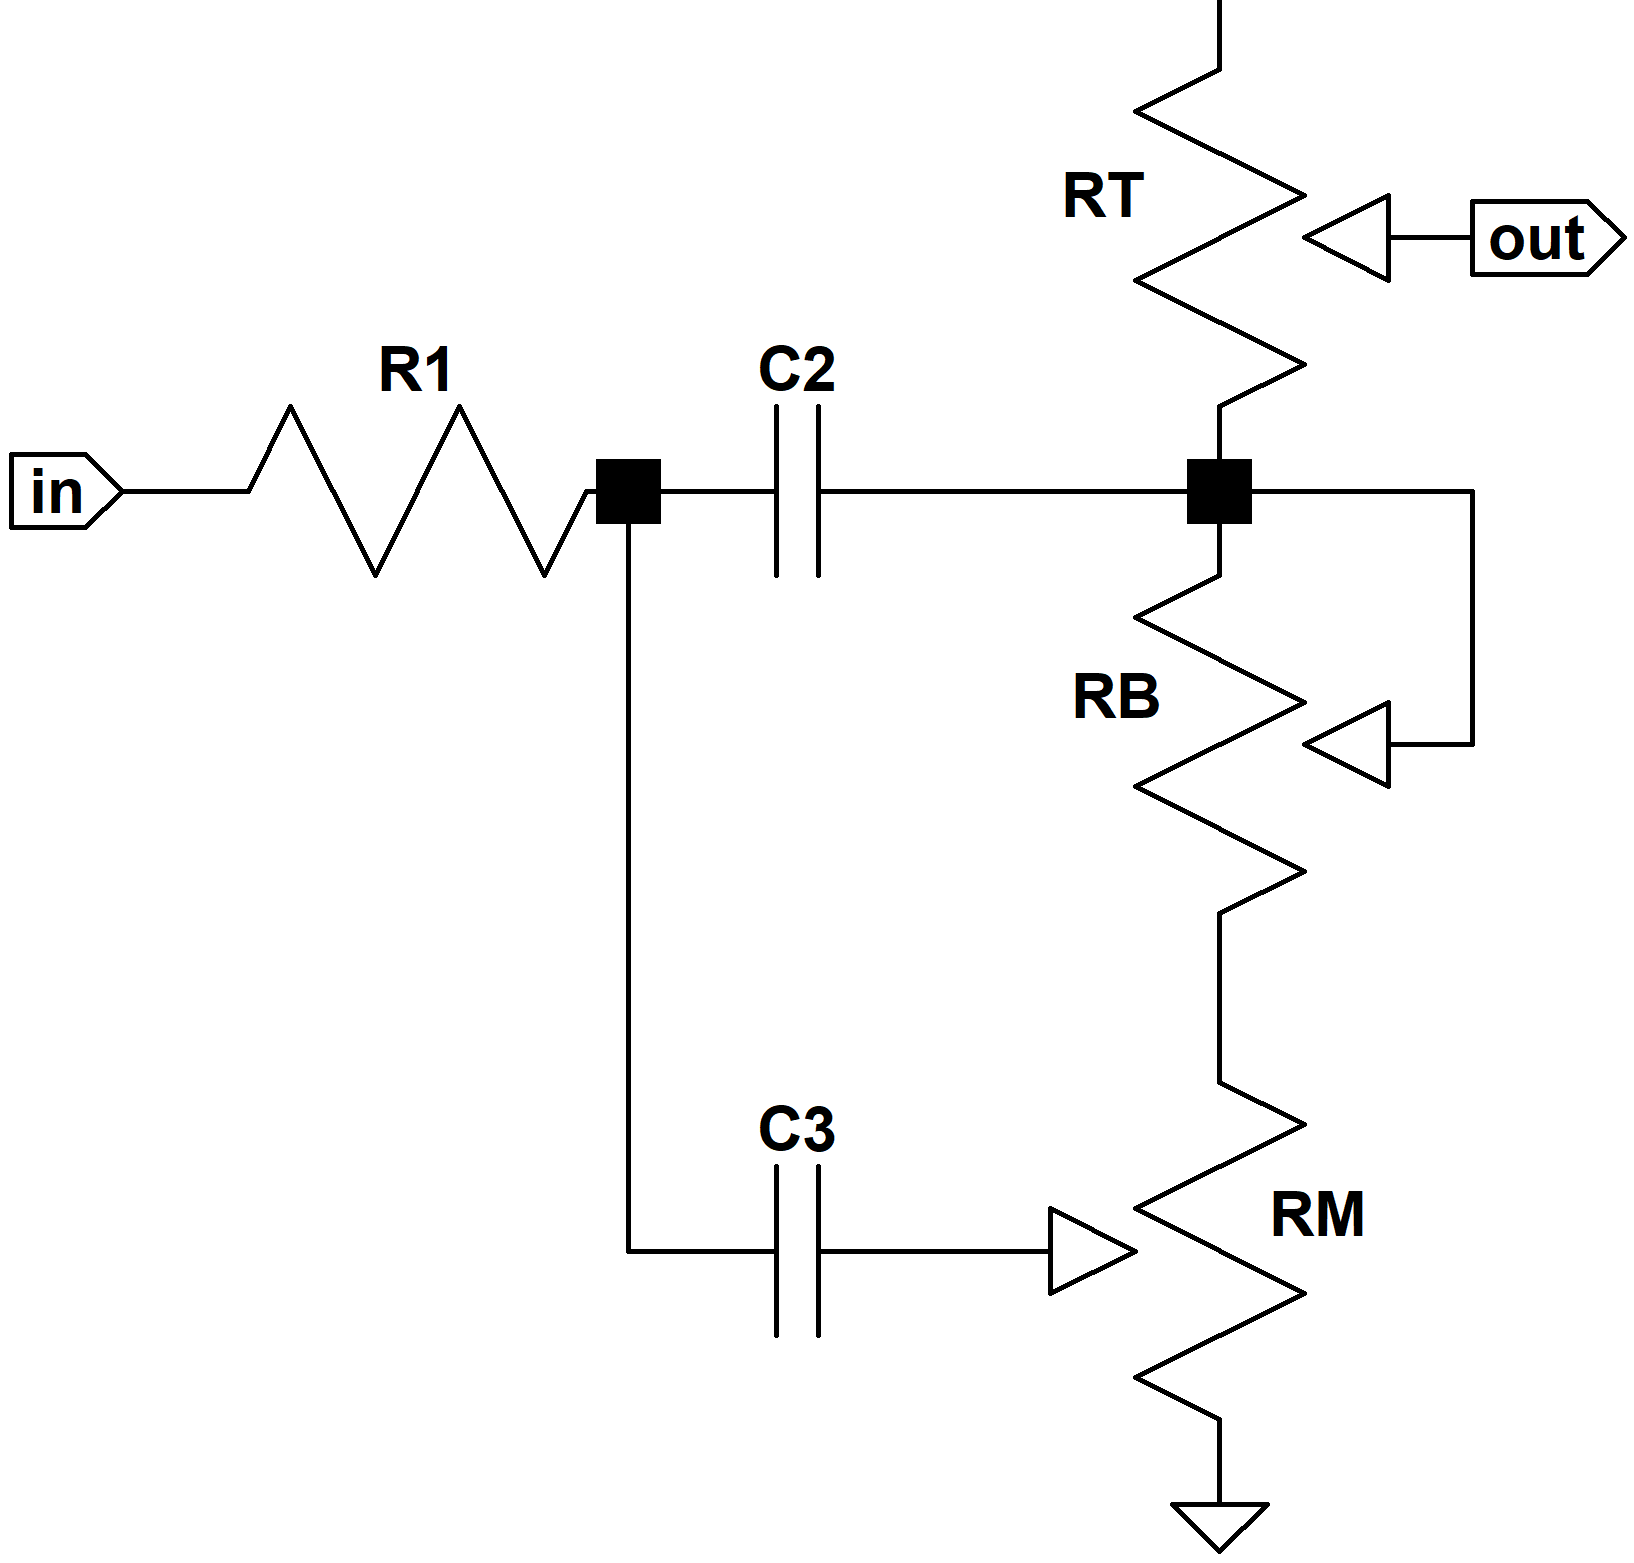
The Bassman-style tone stack serves two purposes: to compensate for the treble and bass attenuation that inevitably occurs at each stage of amplification and to allow the guitar player to adjust the frequency response using bass control RB, middle-range control RM, and treble control RT. The result is an overall gain reduction combined with possible bass and treble boost.
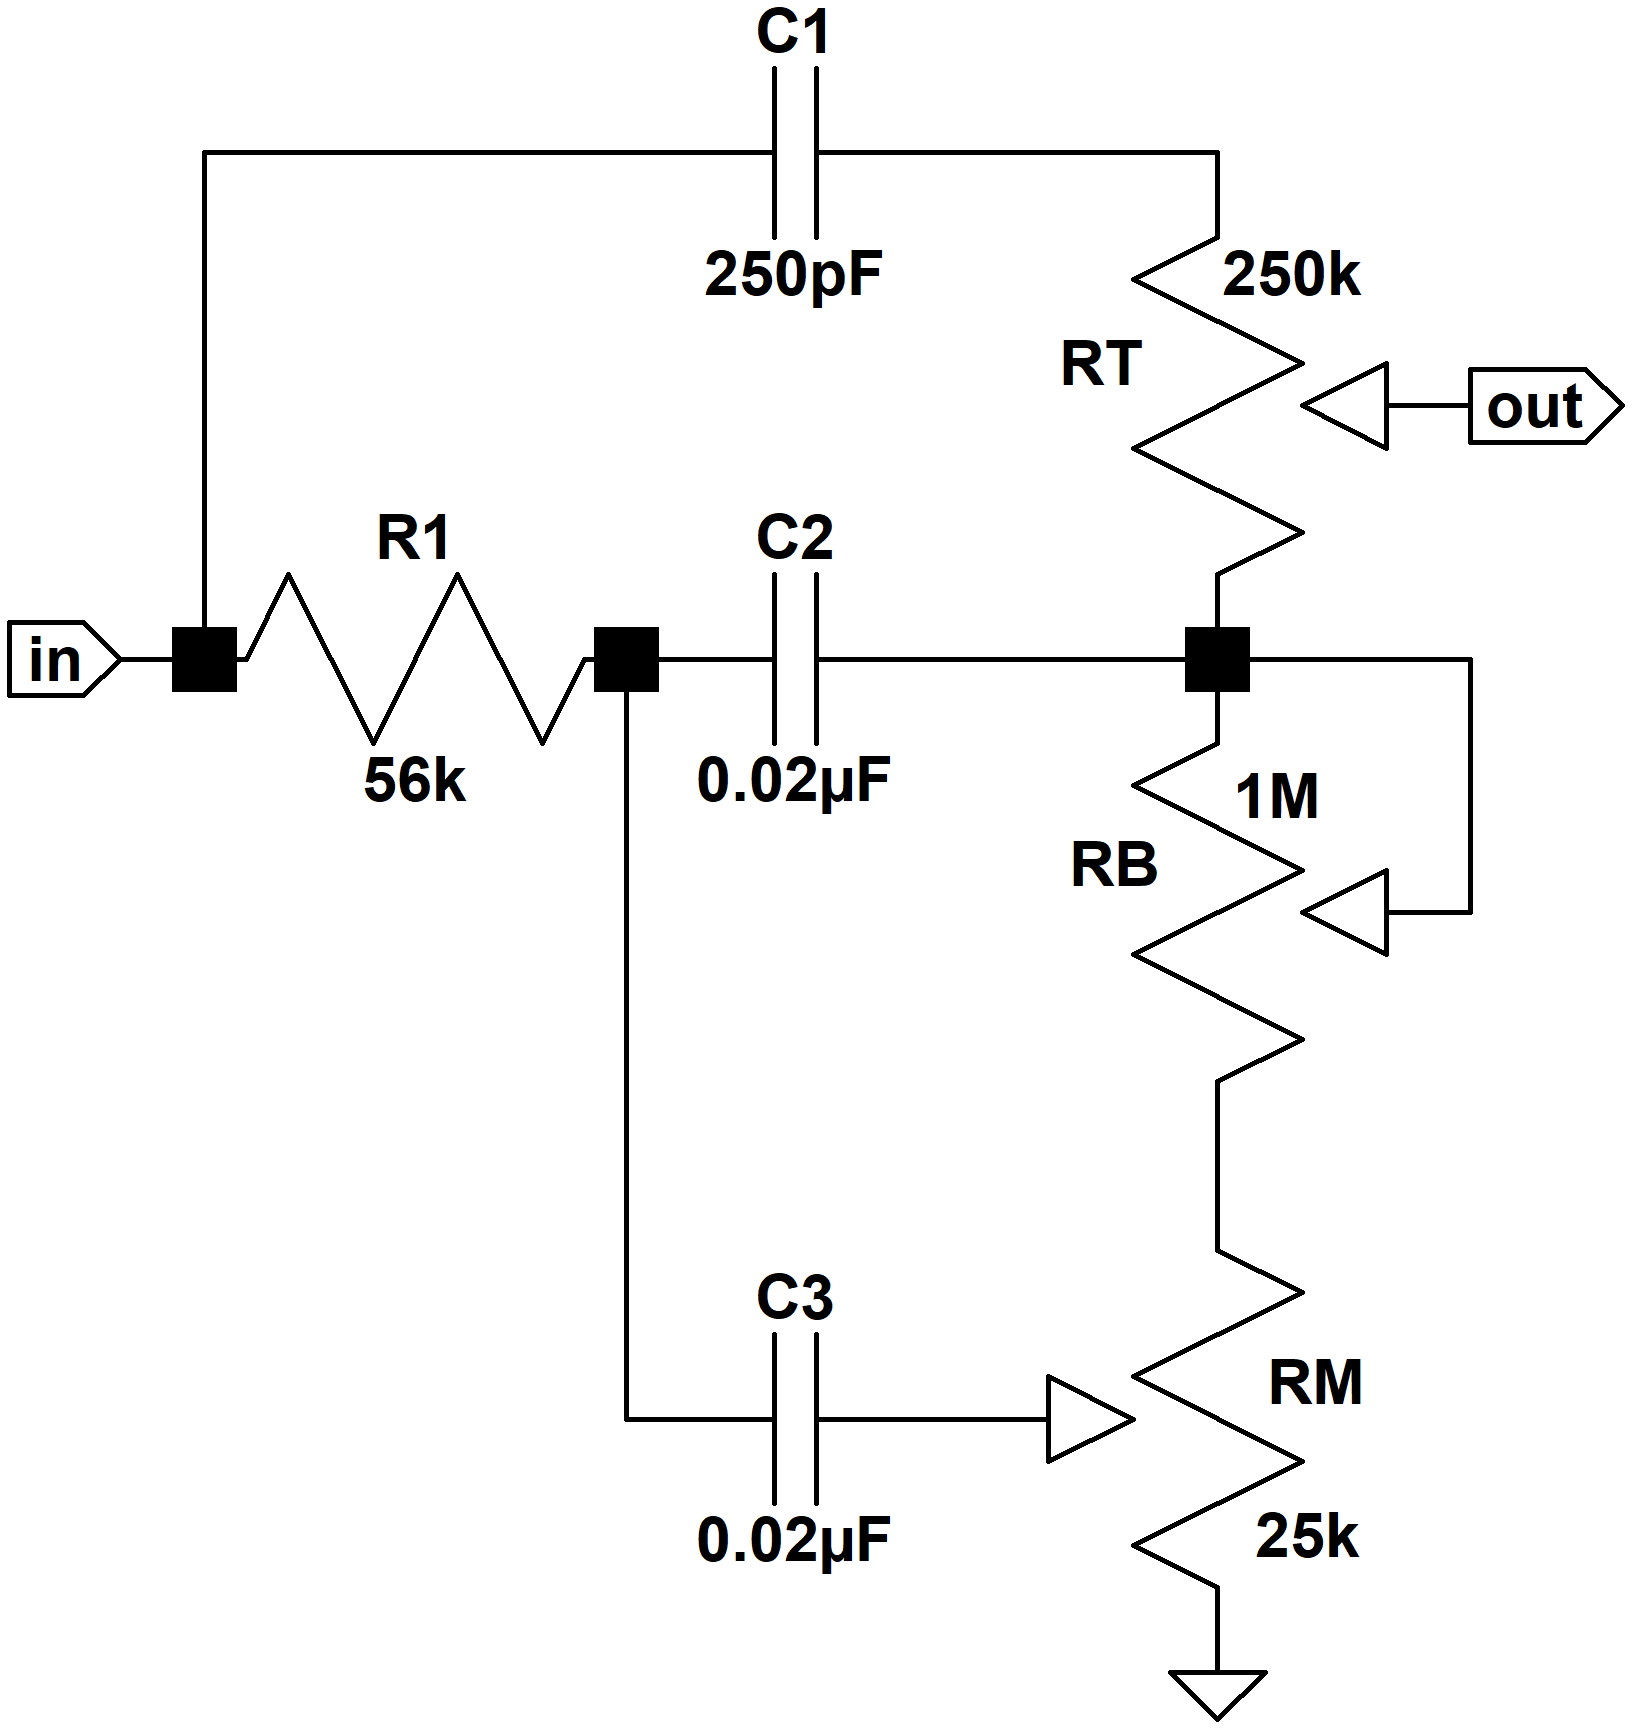
The JMP50 Model 1987 "Plexi" increases the value of C1 to 500pF, decreases the value of R1 to 33kΩ, and increases the values of C2 and C3 to 0.022μF. The Marshall JTM45 was a Bassman 5F6-A clone that eventually evolved into the legendary Marshall designs of later years. It can be argued that increasing the capacitors C2 and C3 by 10 percent was driven more by part availability than tonal considerations. The substantial reduction in R1 and the doubling of C1 were clearly deliberate. In the discussion that follows we will examine the effects of these changes on bass, midrange, and treble response. Along the way we will gain a better understanding of what makes Leo Fender's design one of the most widely copied guitar amp circuits. Finally, we will describe a simple, step-by-step method to calculate the required parts values for a particular frequency-shaping objective.
|
Guitar Amplifier Electronics: Fender Deluxe - from TV front to narrow panel to brownface to blackface Reverb |
Low-Frequency Response
Minimum Bass - Maximum Midrange
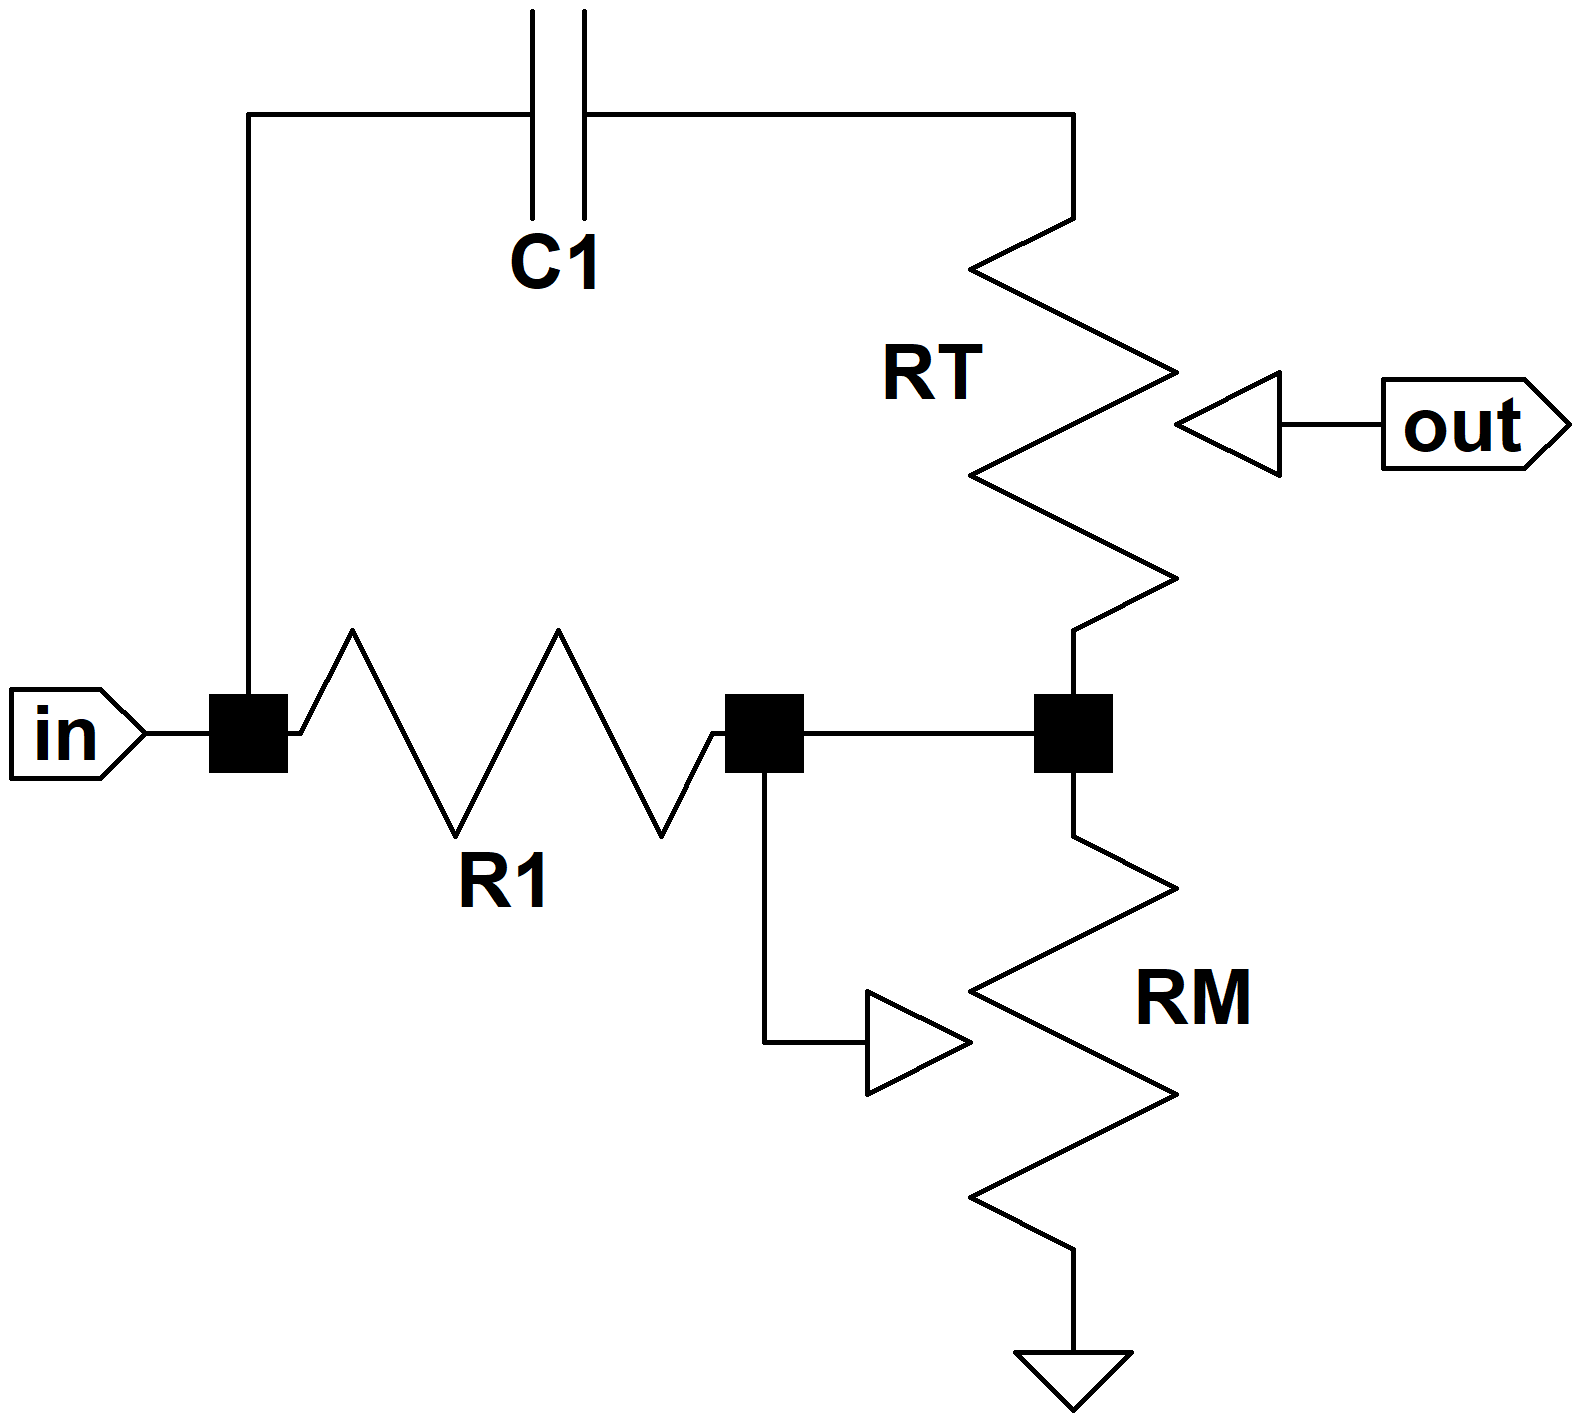
Bass and midrange frequencies are greatly affected by Marshall's substantial adjustment of R1 and somewhat influenced by the 10-percent increase in C2 and C3. To begin our analysis, let's look at bass and midrange frequencies when the bass control is at minimum and the midrange control is at maximum. At bass and middle-range frequencies C1 acts as an open circuit.
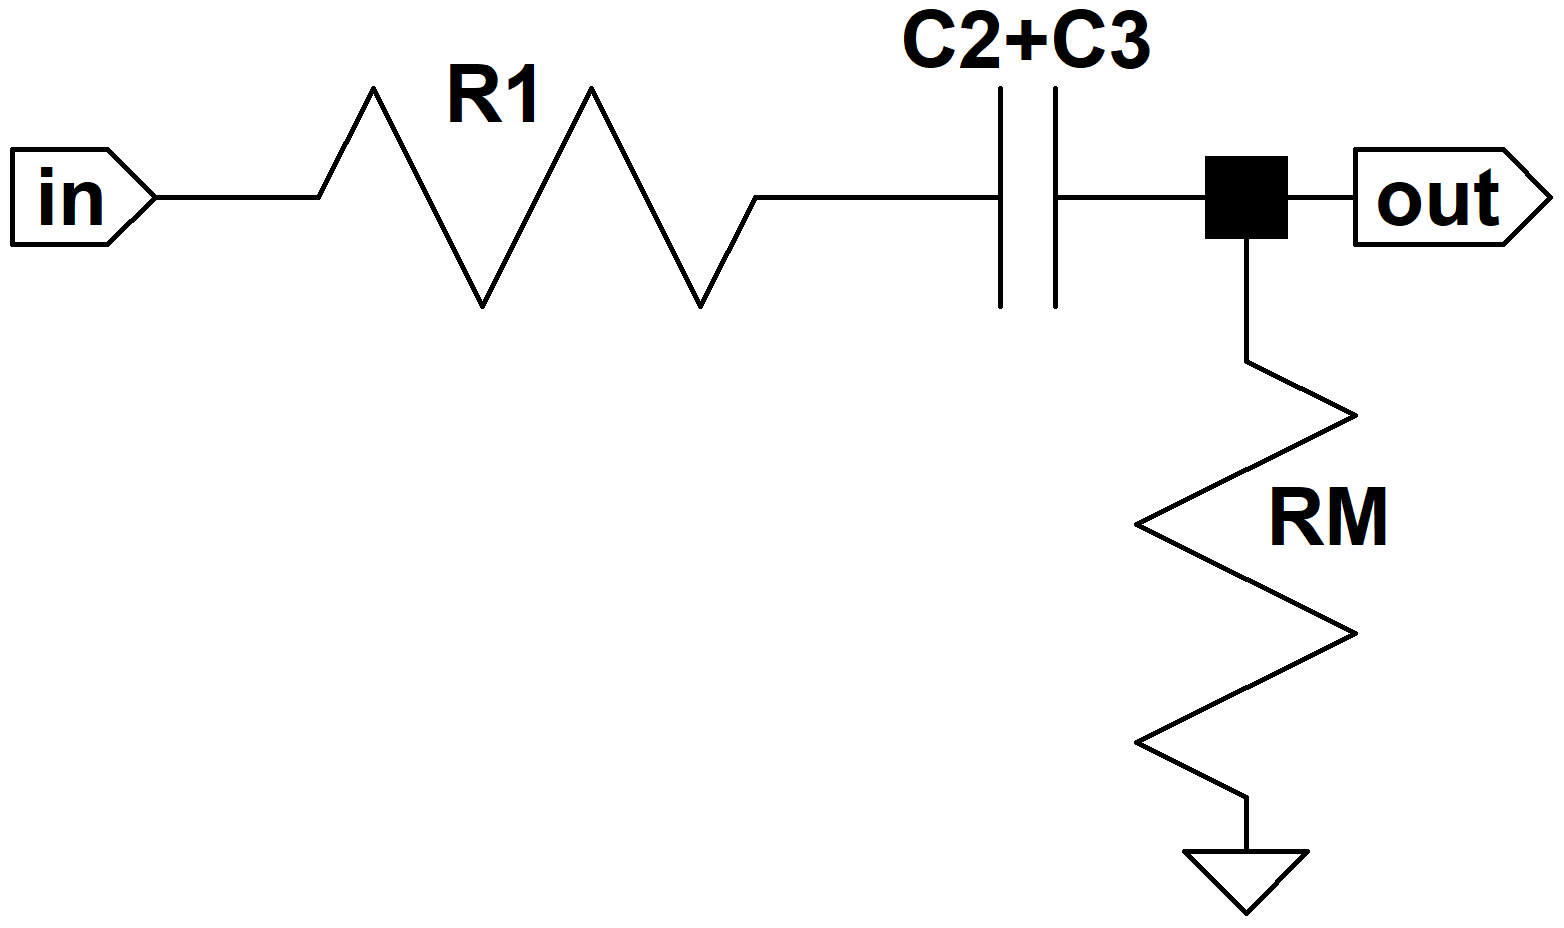
Because of the high input impedance of the long-tailed-pair phase inverter, there is almost no current flowing through the treble control, thus making its particular setting irrelevant. According to Ohm's Law, the voltage at the top and bottom of the control is essentially the same at midrange and bass frequencies. With the bass control at minimum and the midrange control at maximum, the capacitors C2 and C3 are in parallel. Putting all of this together, the circuit looks like this:
The frequency response as a function of s has a pole at p if the denominator of the response equals zero when s = p. The response has a zero at z if the numerator equals zero when s = z. Poles and zeros represent key transition points in the frequency response. If we can derive an equation for one of the poles as a function of two or three component values, for example, then we know how these part values affect this particular transition point.
|
Guitar Amplifier Electronics: Basic Theory - master the basics of preamp, power amp, and power supply design. |
With the bass control at minimum and the midrange control at maximum we get a frequency response of

where C2+3 = C2+C3. We use a bit of algebra to separate the pole and the zero of the response so that we can manipulate and graph them individually:

where


We observe that there is a zero at s = -a and a pole at s = 0.
Let's take a look at the extremes of frequency. At DC, where s = 0 we note that H(s) = 0 and there is zero output. At extremely high frequencies, where s approaches infinity, it becomes much larger than a and the response is

Both of these conditions make sense, because at DC C2+3 is an open circuit, producing zero output, and at very high frequencies it acts as a short circuit, producing a simple attenuator formed by the voltage divider of R1 and RM. So we essentially have a simple high-pass filter. Above a certain cutoff frequency the gain is fairly constant. Below it there is increasing attenuation as the frequency decreases. In terms of dB, audio attenuation with the middle-range control set to maximum is

With R1 = 56k and RM = 25k we get a gain of -10dB. The Marshall JMP50 Model 1987 lowers the value of R1 to 33k, which provides -7dB of gain. We conclude that the output signal at middle-range frequencies, middle-range control at maximum, is 3dB higher in the Marshall.
|
Fundamentals of Guitar Amplifier System Design - design your amp using a structured, professional methodology. |
Because of the pole at s = -a the -3dB break frequency is

Using 5F6-A parts values we get f-3dB = 49Hz. In the Marshall, C2+3 is 10-percent higher but R1+RM is 28 percent lower, so the cutoff frequency rises to f-3dB = 62Hz.
Here is the Bode magnitude plot for the 5F6-A.
To plot it we note that the overall gain in dB can be separated into the sum of two parts: one due to the gain constant and the zero and the other due to the pole:

For the term

we plot a line rising at a slope of 20dB per decade passing through the 0dB line at a frequency of

for the 5F6-A. For the Marshall the 0dB crossing frequency is 147Hz because the capacitors are 10-percent larger.
The break frequency for the term

is

so for frequencies below 49Hz we plot a straight line at 0dB. At 49Hz we extend a line that decreases at a rate of 20dB per decade. The approximate gain is the sum of the two components that we have just plotted. Below 49Hz it is a straight line rising at the rate of 20dB per decade until it reaches -10dB at 49Hz. Above 49Hz it remains a constant -10dB. The actual gain is 3dB lower at the break point, as shown in the figure. At frequencies much higher or much lower than 49Hz the approximate gain and the actual gain are almost identical.
For the Marshall we get a higher break frequency and 3dB less midrange attenuation.
|
Guitar Amplifier Electronics: Circuit Simulation - know your design works by measuring performance at every point in the amplifier. |
Maximum Bass - Minimum Midrange
With the bass control at maximum and the midrange control at minimum C3 is connected to ground.
The low to middle-range frequency response is then approximately

This approximation holds when RB is much larger than R1, which is the case for both the Fender and Marshall designs. With a little algebra the formula can be rearranged to a form suitable for a Bode plot:

where


There is a zero at s = 0, a pole at s = -a1 and a pole at s = -a2. Let's take a look at the extremes of frequency. At DC, where s = 0, we note that H(s) = 0 and there is zero output. At extremely high frequencies, where s approaches infinity, its magnitude becomes much larger than a1 and a2 and the response approaches

This means H(s) approaches zero at extremely high frequencies, because s is in the denominator and is infinitely large. Both of these conditions make sense, because at DC the capacitors are open circuits, producing zero output, and at very high frequencies C3 short circuits the output directly to ground. So this is a bass bandpass filter. The break points of the two poles are:


For the Marshall, the slightly larger value of C2 lowers the low break frequency by 10 percent. The significantly smaller value of R1 increases the high break frequency to 219Hz.
Here is the Bode magnitude plot for 5F6-A component values.

For the term

we plot a line rising at a slope of 20dB per decade passing through the 0dB line at a frequency of

The break frequency of the term

is exactly the same frequency:

For the Marshall the crossing frequency and break frequency are at 7.2Hz. (The crossing and break frequencies in both cases are identical. From the Bode magnitude plot we see that this means the response is minus 3dB at the crossing frequency and then nearly 0dB in the middle of the passband. Bass frequencies in the middle of the passband have little attenuation, so if middle-range frequencies are significantly attenuated, the effective result is bass boost.)
Using 8Hz for the 5F6-A, we begin by plotting a horizontal line at 0dB. At 8Hz we extend a line that decreases at a rate of 20dB per decade.
We apply the same procedures for

where the break frequency is

The approximate gain is the sum of the three components that we have just plotted and the actual gain is 3dB lower at each of the two break points, as shown in the figure.
Here is the Bode magnitude plot for Marshall's part values.
Conclusions - Low-Frequency Response
The Marshall JMP50 Model 1987 tone stack lowers the value of R1 by 41 percent, from 56k to 33k. This modification is obviously deliberate, and it has substantial effects on bass and low-midrange response. Marshall also raises the values of C2 and C3 by 10 percent, from 0.02uF to 0.022uF, which is likely to be just a parts availability issue. Nevertheless, the capacitor modification does introduce subtle shifts in tone stack response.
With the bass and treble controls at minimum, the midrange control determines the overall attenuation for all guitar frequencies. When the bass control setting is increased, it allows bass to bleed back into the mix, reducing the attenuation for its passband. With the midrange control set to maximum, the Marshall has 3dB less overall attenuation, -7dB gain for the JMP50 versus -10dB for the 5F6-A. We conclude that the Marshall midrange control offers more midrange at the top end of the control setting, but a more accelerated gain variation depending on the setting. The 5F6-A, on the other hand, has less maximum midrange, but finer midrange control.
Marshall's modifications for the guitar raise the low frequency cutoff for the midrange control from 49Hz to 62Hz. For an electric bass this would cause bass cut at low bass control settings, something not seen in the Bassman. We can speculate that Fender's design was driven by the fact that the 5F6-A was designed to be a bass amplifier. The choice of cutoff ceases to carry any significance at 82Hz and above.
The Marshall version clearly shifts more midrange notes into the range of the bass control, allowing more of them to bleed back into the mix. Marshall raises the upper cutoff frequency a whopping 54 percent, from 142Hz to 219Hz. These frequencies don't represent sharply defined shifts in frequeny response, because the transition between the tone stack's bass and midrange response is fairly gradual. At the upper end of the bass passband, even with the bass control set to maximum and the midrange control at minimum, midrange cut increases at the rate of only 20dB per decade, or 6dB per octave. Marshall thus raises this gradual transition region to higher frequencies.
High-Frequency Response
Next we will examine the treble effects of Marshall's modification to the value of C1, raising it from 250pF to 500pF. Intuitively we anticipate increased treble boost. This is indeed the result, but not in the way we might expect.
Like we did with bass and midrange, we will determine the key gain and transition frequencies through the use of a Bode magnitude plot. Once these are known, the effects of Marhall's C1 modification will be clearly evident. Finally, we describe the overall conclusions that can be drawn.
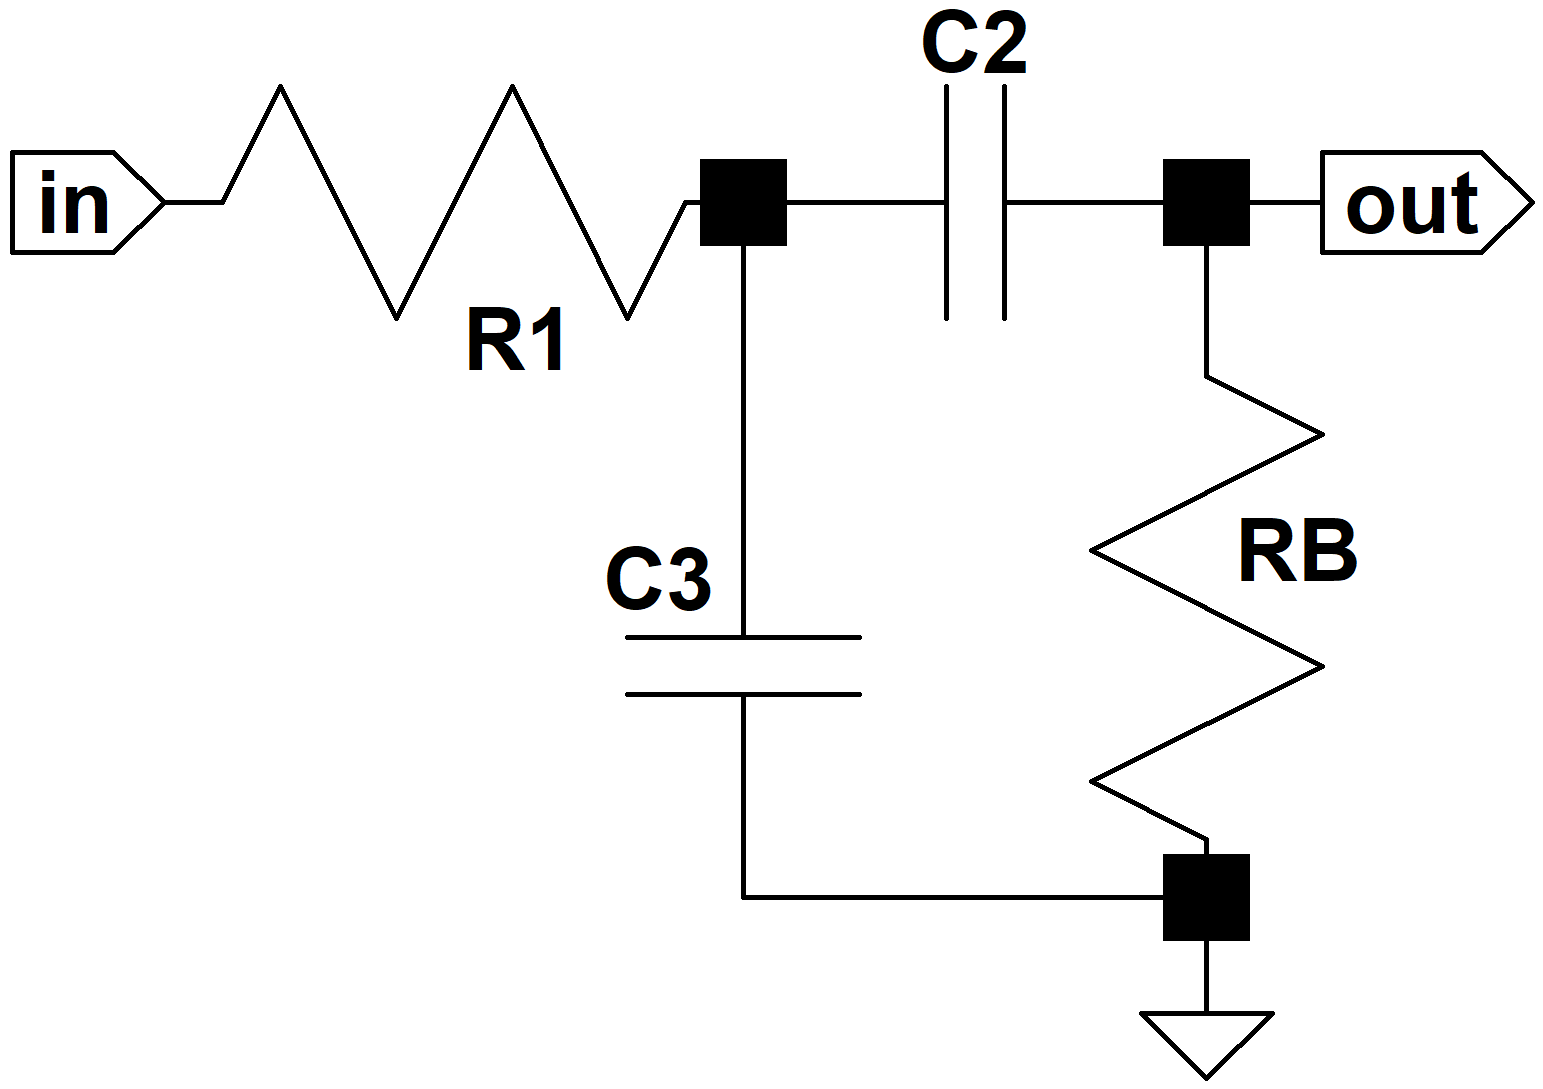
At high frequencies the large capacitors C2 and C3 act as short circuits, shorting out the bass control.
With the middle-range control at minimum, it is also shorted out.
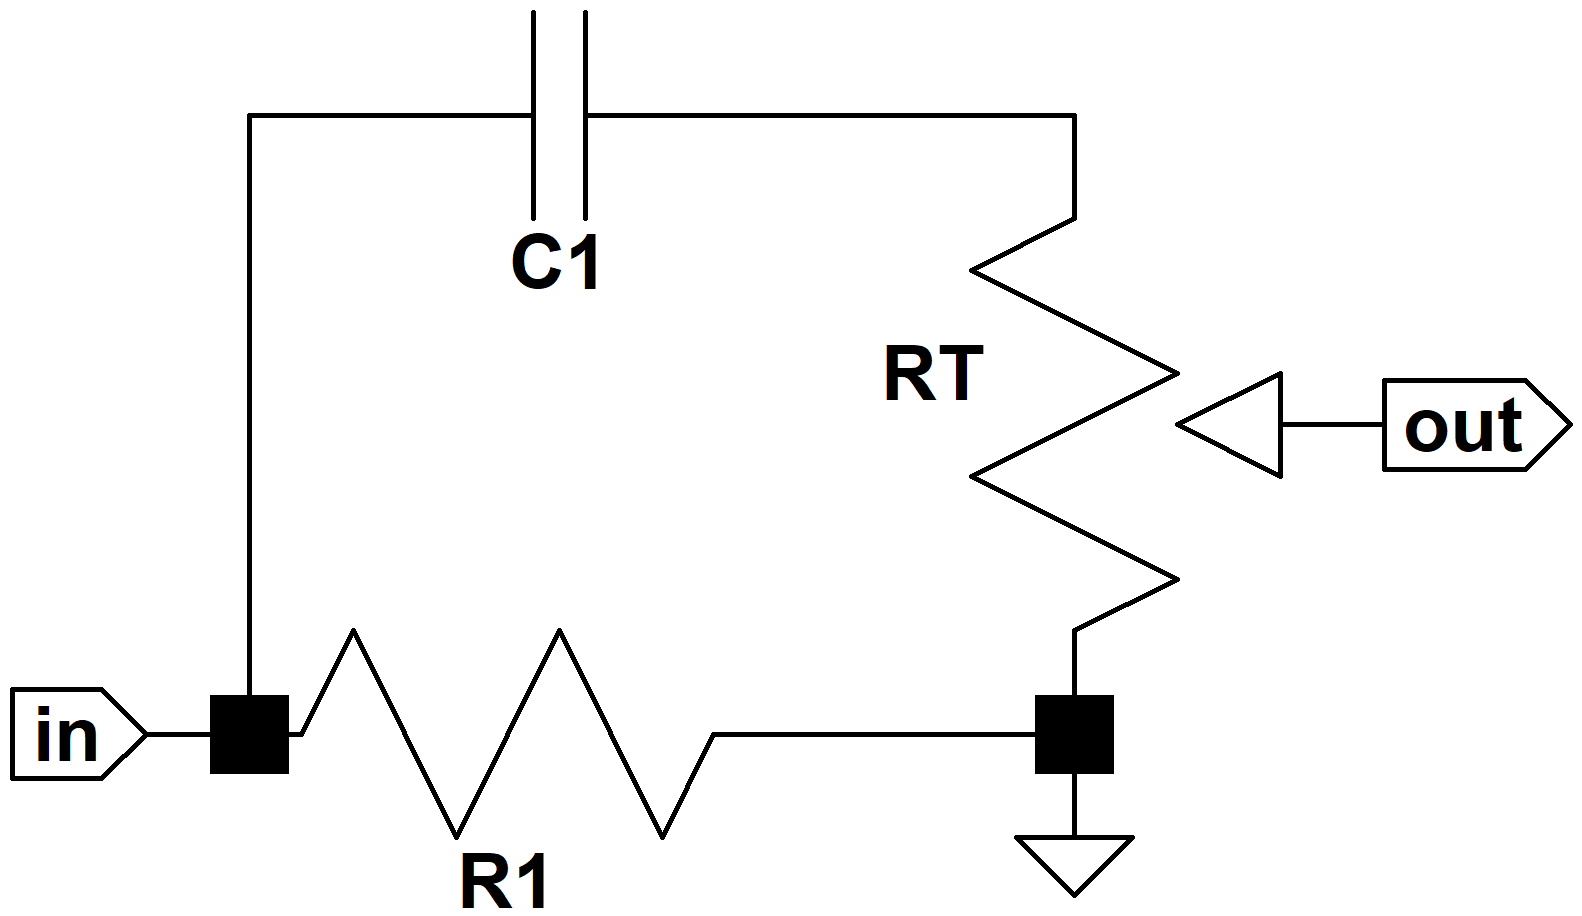
Under these conditions the frequency response is

where t varies between zero (treble control at minimum) to 1 (treble set to maximum). With some algebra we put this into a form suitable for a Bode plot:

where


There is a zero at s = 0 and a pole at s = -a. Notice that the control setting t has no influence on the zero or the pole and comes into play only in the overall gain constant K. The treble control setting therefore has no influence on which frequencies are included in the treble range, only their overall volume level.
Let's take a look at the extremes of frequency. At DC, where s = 0, we note that H(s) = 0 and there is zero output. At extremely high frequencies, where s approaches infinity, its magnitude becomes much larger than the other variables and the response approaches

Both of these conditions make sense, because at DC the capacitor is an open circuit and the output becomes connected to ground through the treble control. At extremely high frequencies the capacitor is a short circuit, so the gain is a constant equal to 1 with the treble control at maximum and zero with the control set to minimum. With the midrange control at minimum, we obtain a high-pass filter that passes all that we consider to be treble and attenuates middle-range and below.
For the Bassman the break frequency is

The Marshall design cuts this in half to 1.25kHz by doubling the value of C1. Here is the Bode magnitude plot for Fender's 5F6-A with the treble control set to maximum and the midrange control at minimum.
Here's how we constructed this plot. For the term

we plot a line rising at a slope of 20dB per decade passing through the 0dB line at a frequency of

The break frequency of the term

is

Similar to what we saw for bass frequencies, the crossing frequency for the zero is identical to the break frequency for the pole, regardless of the resistor and capacitor values. From the Bode magnitude plot we see that this means that the response is -3dB at the crossing frequency and then nearly 0dB for all frequencies higher than this. Since middle-range frequencies are attenuated by at least 10dB in the case of Fender, or 7dB for Marshall, setting the treble control to maximum effectively causes 10dB (or 7dB) of treble boost.
For the pole we begin by plotting a horizontal line at 0dB. At 2.5kHz we extend a line that decreases at a rate of 20dB per decade.
The approximate gain is the sum of the two components that we have just plotted and the actual gain is 3dB lower at the break point, as shown in the figure. For the Marshall design the plot is identical, except it is shifted left by 1.25kHz.
Conclusions - High-Frequency Response
By reducing the lower cutoff frequency, the Marshall JMP50 Model 1987 shifts more guitar frequencies into the range of the treble control. At high treble control settings these frequencies are boosted along with the rest of the treble range. This is very similar to what we saw at low frequencies, where the upper cutoff for the bass passband was shifted higher by 54 percent. When observed in this context, we conclude that Marshall modifications effectively narrow the range of frequencies defined to be middle-range, shifting the upper and lower extremes of 5F6-A midrange to Marshall's bass and treble controls.
Both the 5F6-A and the JMP50 have 0dB gain at treble frequencies. Increasing the size of C1 thus provides no additional treble boost for high-frequency harmonics that are well into the treble passband. Instead, increasing this value allows lower frequencies to share in the overall boost.
Creating Your Own Design
The tone stack is perhaps the most complex system in an amplifier, both technically and philosophically. Its components are purposely designed to have reactive impedances that vary significantly with frequency over the entire audio band. There is also considerable interaction between the controls, offering us more challenges. As a result, we need to pull out all the stops to make the design process simpler.
In situations like this, SPICE simulation appears to be a convenient solution. We can specify all the parts values and get the frequency response with 64-bit digital precision. What we really want, however, is the reverse. We want to transform a desired frequency response into a list of appropriate parts values. The procedure described here, which is based on Hendrik Bode's methods, represents a nostalgic, mid-twentieth century approach that would have been very familiar to Leo and Jim.
First, we need to observe our design environment. Fender's tone stack is driven by a cathode follower. This means our driving stage has a relatively low output impedance of less than 1kΩ.1 The tone stack also drives a phase inverter with a relatively high input impedance.2 Both of these conditions are ideal. They give us maximum flexibility to achieve our design goals, because the tone stack can be designed independently, without integrating the characteristics of the driving and driven stages. If we choose to drive this stack directly from a preamp stage, as in the Fender Vibro-Champ AA764, or use it to drive a 100kΩ volume control, then all bets are off. In that case we need to go back and repeat the Bode analysis described above and include some extra variables. Leo Fender purposely placed his tone stack between a cathode follower and a long tailed pair, and Jim Marshall saw no reason to alter this concept. It offers maximum design flexibility by making the tone stack response independent of the driving and driven circuits.
Chosing R1 and RM
Midrange is a good place to start. This sets the overall attenuation for all frequencies when the bass and treble controls are minimum. First we choose a value for RM. For a lot of midrange scoop and finer midrange control it can be dropped to 10k, but 25k usually works fine. The value of R1 is then a function of RM and the desired midrange attenuation:

Here A is a positive number representing the amount of attenuation in dB with the midrange control at maximum. As reference points, for the Fender Bassman 5F6-A we have A = 10, whereas for the Marshall JMP50 the value is A = 7.3.
As the bass and treble control positions are increased, these frequencies bleed back into the mix and suffer less attenuation. At the center of the bass and treble passbands with the controls at maximum these signals suffer almost no attenuation.
At the boundaries between bass and midrange and between midrange and treble, the frequency response changes at a maximum rate of 6dB per octave. The positioning of these transition regions is very important to the tonal characteristics of the amplifier. It is here that the response changes as the player moves up and down the scale. It could be Lydian, Dorian, or perhaps even Mixolydian - it doesn't matter. As the guitar player moves up or down the scale, the response steadily changes at about 6dB per octave. As circuit designers, we're essentially deciding where on the neck these transitions take place. Once the signal is well into the passbands, the response is more constant, and under the full control of the bass and treble knobs.
Setting C3
Once the values of RM and R1 are set, we define the upper end of the bass passband. This is a function of both R1 and C3, but since we've already set the resistor value we have only one variable to left adjust: the capacitor. The -3dB bass upper break frequency defines the top end of the bass band and the start of the transition from bass-knob control to midrange-knob control. As reference points, Fender's 5F6-A uses a frequency of 142Hz. Marshall increases this to 219Hz. For even more perspective, the guitar's low E string is at 82Hz; the open D string is at 147Hz; and the high E string is at 330Hz.
The value of C3 corresponding to our desired break frequency f1 is

Setting the frequency higher places more lower-midrange frequencies under the direct control of the bass knob. This means more bass frequencies tend to move together as a group. Setting the upper break frequency lower puts more bass into the transition region between bass and midrange, where the response decreases as the frequency moves higher.
Setting C2
Next we can finish off the base passband design by calculating the value of C2. The tone stack obviously has infinite attenuation at DC because the signal has to pass through at least one capacitor to get to the next stage. So there must be a lower end to the bass passband. It turns out, however, that the lower end is way below the range of guitar audio as long as we keep the bass control RB sufficiently large. It is a good idea to leave it at 1MΩ, consistent with both Fender and Marshall designs.
The important characteristic determined by C2 is the amount of bass attenuation with the bass control set to minimum. In keeping with the spirit of Fender's design, bass attenuation should equal midrange attenuation if the bass control is at minimum and the midrange control is at maximum. (Feel free to violate this rule, however, if you have a particular grudge against bass.) The value of C2 as a function of the break frequency f2 for these control settings is

For Fender the break frequency was 49Hz, which was certainly influenced by the fact that the 5F6-A was intended to be a bass guitar amp. Marshall increased the break frequency to 62Hz. Below the break frequency that we choose, the response drops off at a rate of 6dB per octave.
Setting RT and C1
Treble is saved for last. For treble frequencies we have a lot of flexibility, because the lower break frequency is a function of the product of RT and C1. This kind of leeway represents are rare opportunity to consider the cost of the components. For purely economic reasons we want the capacitor to be fairly small, but not so small that it is nearly the same as parasitic capacitance due to parts placement. Otherwise the response will be dictated by how we route the wiring. Fender's choice of 250pF represents a lower limit. If we choose to increase the lower treble break frequency beyond Fender's design, then it would be wise to consider keeping Fender's 250pF capacitor value the same and reducing the value of RT. In the opposite direction, towards a lower treble passband, increasing C1 is the most convenient.
The capacitor value based on our choice of treble control and break frequency is

There you have it - tone shaping a la carte! A lot of math went into deriving these formulas, but using them is quite easy. The hardest part is understanding what the break frequencies represent.
As we tweak Leo's tone stack design, even to the point of completely changing all the parts values, it's important to maintain some humility and perspective. We're not creating an entirely new circuit, nor are we inserting it into a new signal environment. Moreover, Jim Marshall demonstrated decades ago that the passbands for bass, midrange, and treble can be altered in a systematic way. The methodology described here merely quantifies what has been achieved by two legendary circuit designers. There are certainly other ways to analyze this tone stack and other methods to compute the desired parts values. What is outlined here represents just one approach that seems to work well.
Further Reading
1Richard Kuehnel, Circuit Analysis of a Legendary Tube Amplifier: The Fender Bassman 5F6-A, 3rd Ed., (Seattle: Pentode Press, 2009).
2 ibid., p. 93-96.